Airtable Analytics & BI Tool
Build dashboards on Airtable data and join it with SQL databases, MongoDB, REST APIs, and 30+ sources — no ETL required. AI-powered analytics you can white-label and embed.
Trusted by the world's best


Connect to Airtable in Minutes — No Middleware Required
Airtable is where teams organize projects, track inventory, manage pipelines, and run operations. But when you need analytics beyond built-in charts, most tools force you into CSV exports or complex API scripts.
Knowi connects directly to the Airtable REST API using your Personal Access Token. Pull records from any base and table, apply Airtable formulas as server-side filters, and handle pagination automatically. No ODBC drivers, no middleware, no data pipelines. See the setup guide.
Join Airtable with PostgreSQL, MongoDB & REST APIs
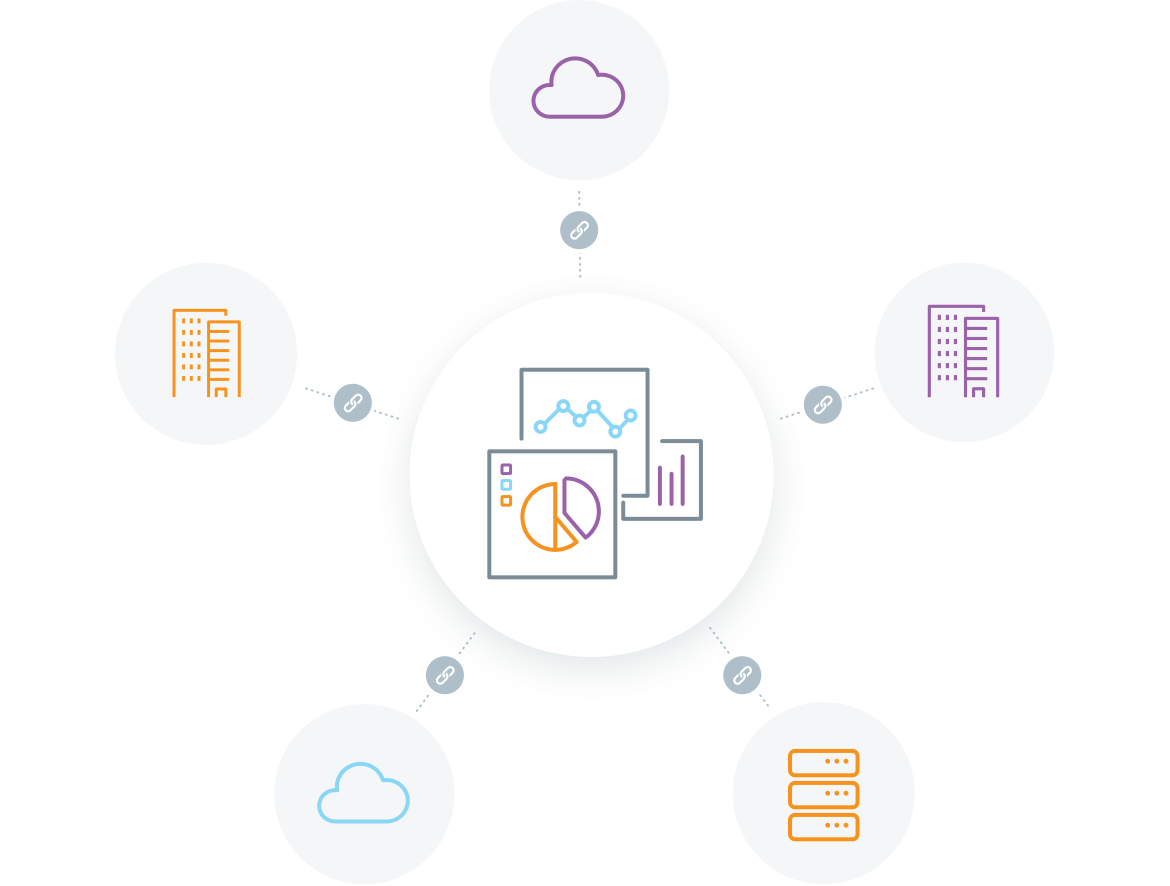
Your data doesn't live in Airtable alone. Customer records sit in PostgreSQL, event data in MongoDB, revenue figures in Stripe's API, and project tasks in Airtable. Most BI tools connect to one source at a time.
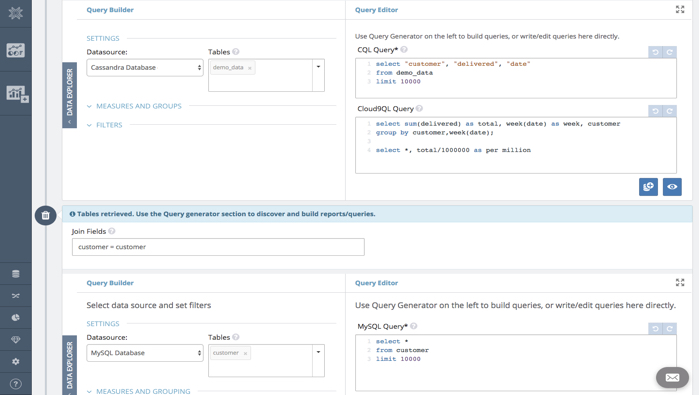
Knowi joins Airtable data with PostgreSQL, MySQL, MongoDB, Snowflake, Elasticsearch, REST APIs, and 30+ other sources — all in a single query, no ETL pipelines or data movement. Correlate Airtable project data with financial records, CRM data, or operational metrics without building a data warehouse. Learn how cross-source joins work.
AI-Powered Analytics on Airtable Data
Airtable formulas and views are useful, but they can't do what a real BI tool can — cross-source joins, statistical analysis, time-series forecasting, and cohort breakdowns.
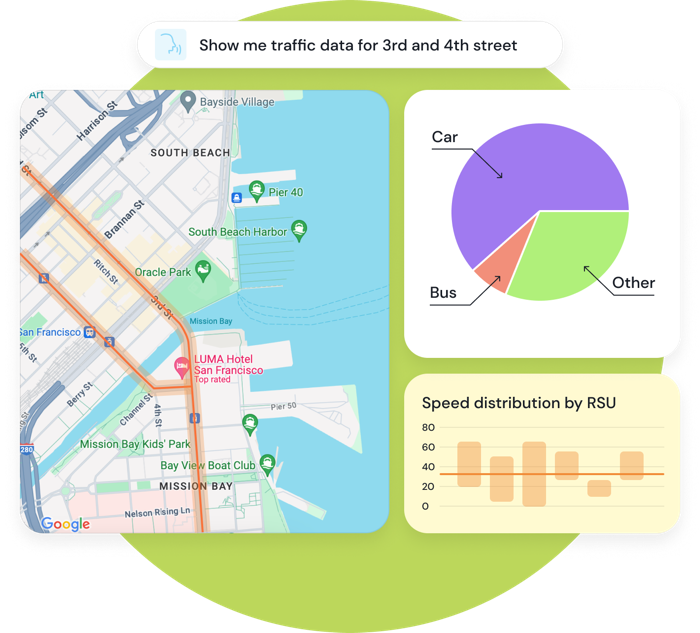
Knowi lets business users ask questions in plain English. "Show me project status by team for this quarter" returns an instant visualization from your Airtable data. No API knowledge, no formulas, no code. From question to dashboard in seconds.
Built for Airtable — Not Bolted On
Most BI tools treat Airtable as an afterthought. Knowi treats it as a first-class data source with native API support.
With Knowi
- Native REST API connection with auto-pagination
- Airtable formula filters pushed server-side
- Cross-source joins with SQL databases and APIs
- AI queries on Airtable data in plain English
- White-label embedding with multi-tenant isolation
Power BI, Tableau, Looker
- Require third-party connectors or CSV exports
- No server-side formula filtering
- Single-source only — no cross-database joins
- No AI query generation for Airtable
- Limited or no multi-tenant embedding
Airtable Analytics Features

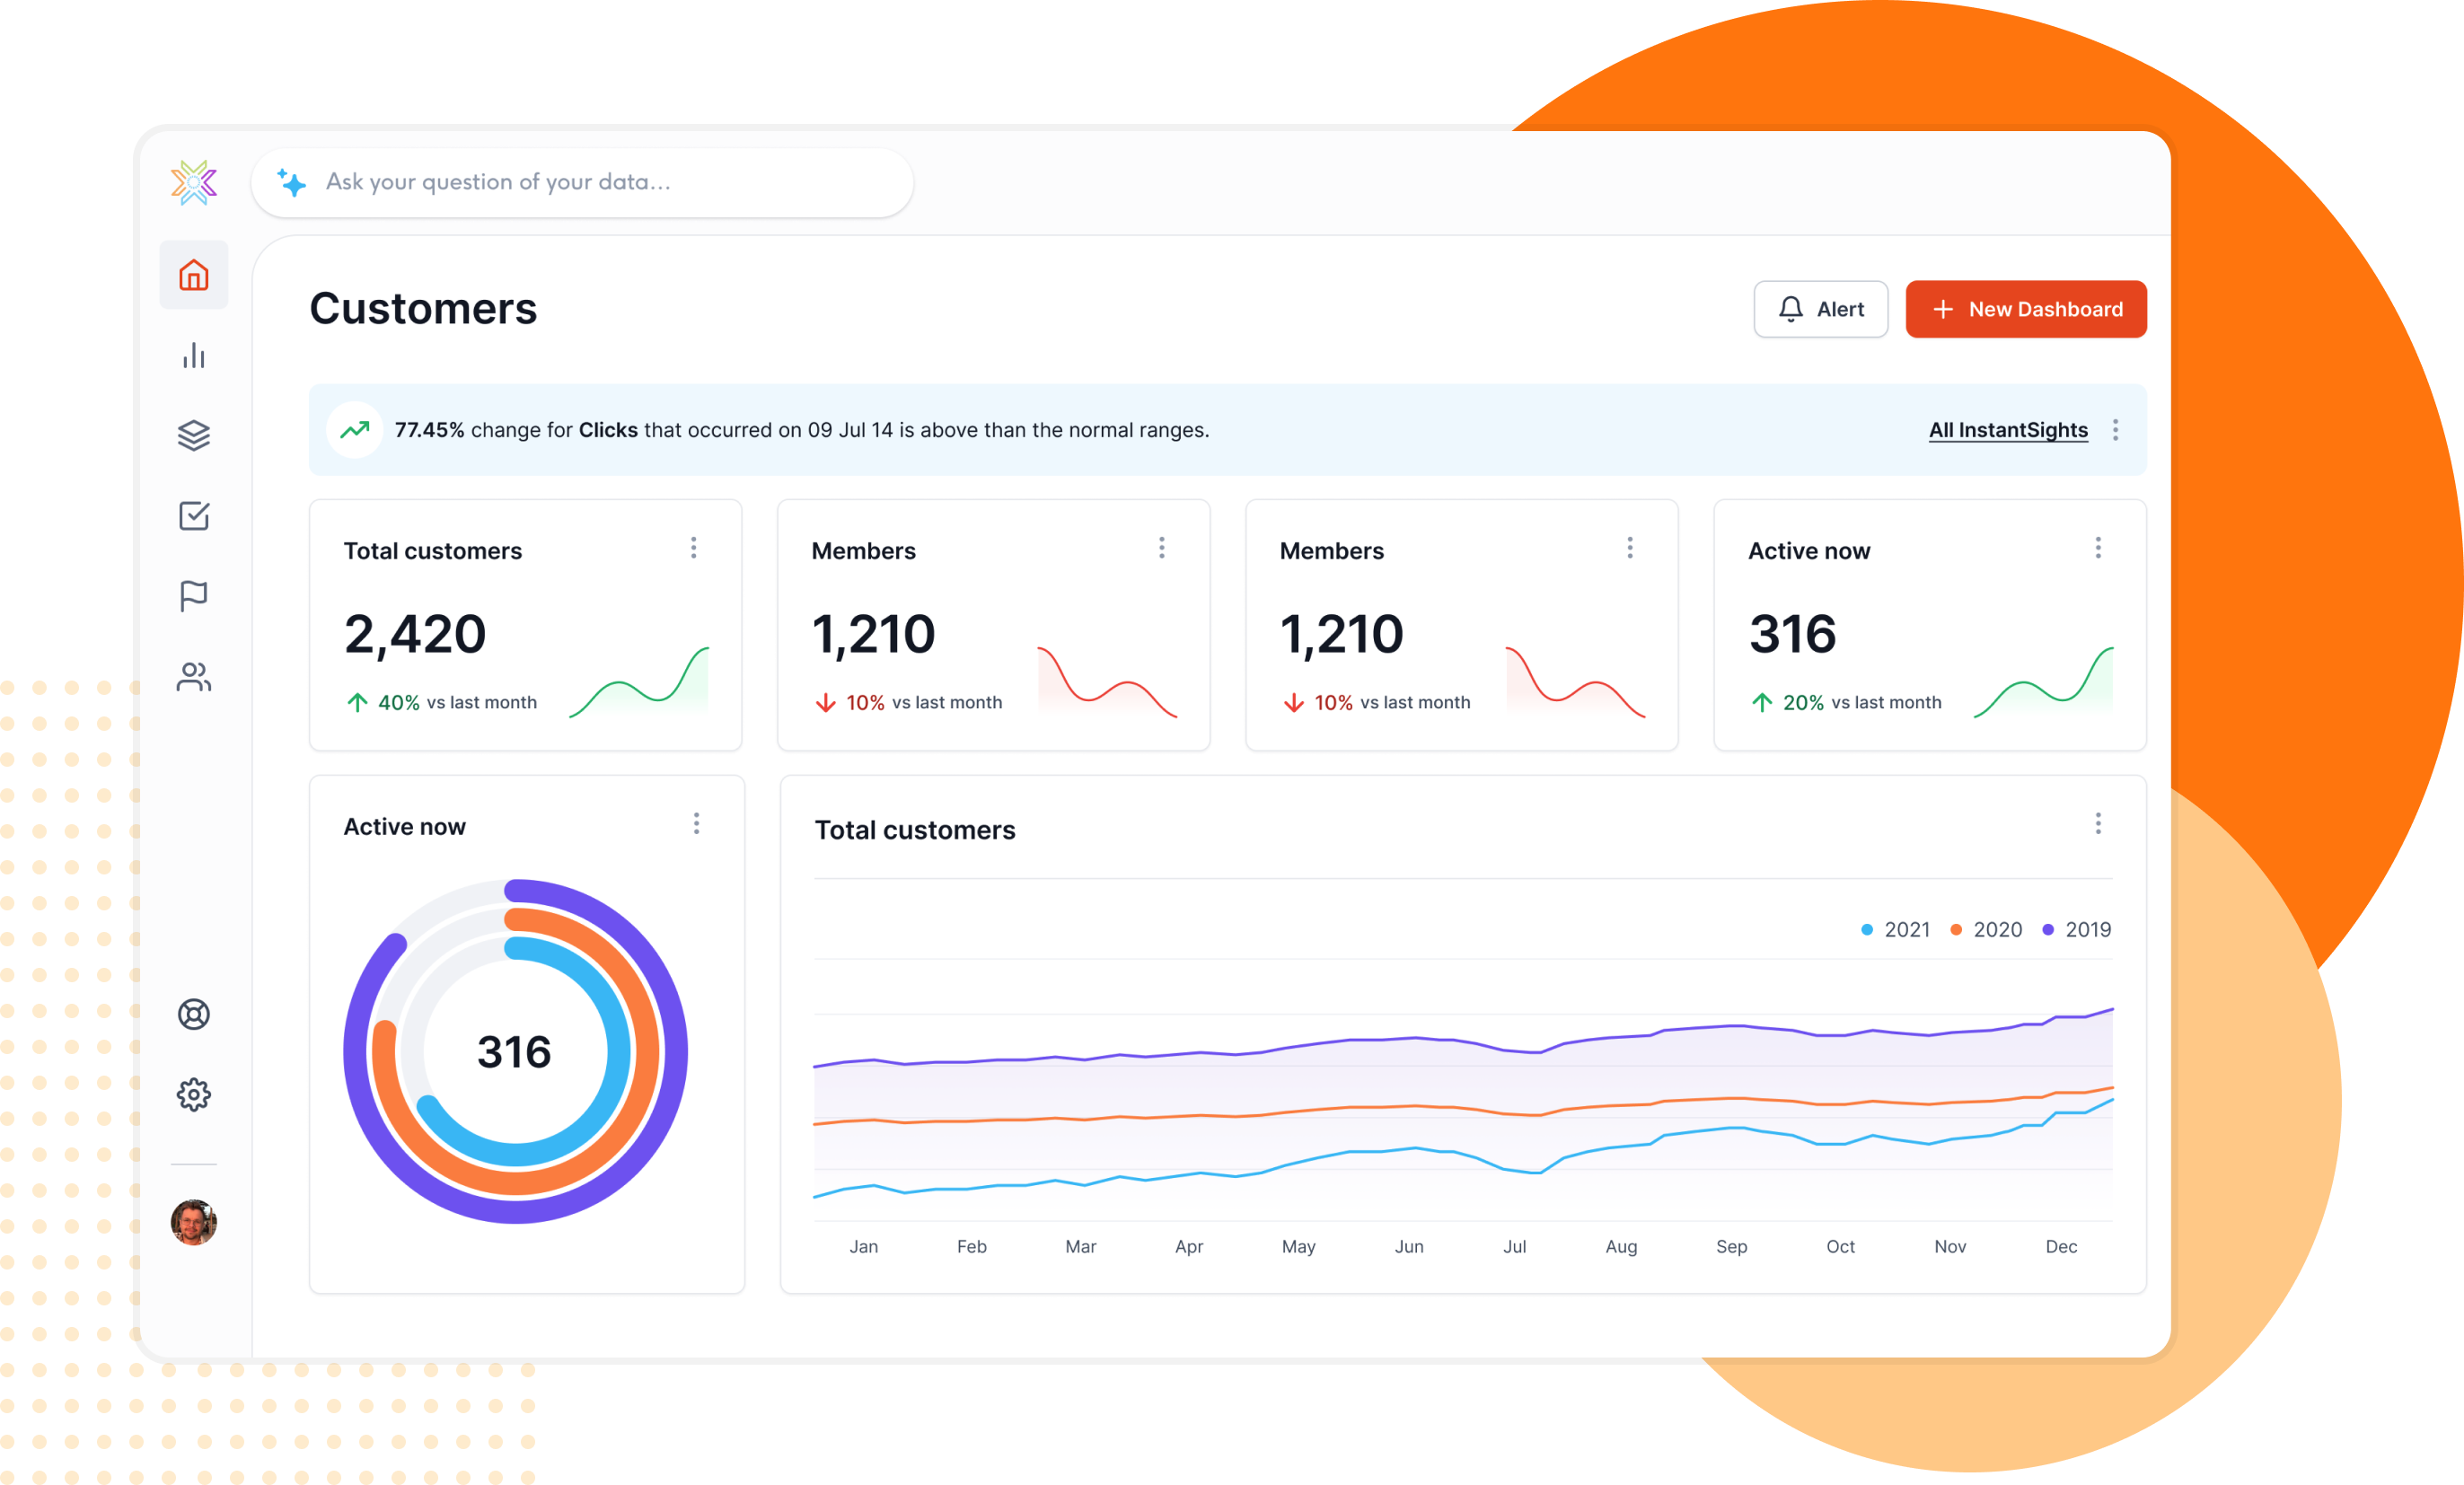
Self-Service Analytics
Business users build their own dashboards on Airtable data. Drag-and-drop analytics, natural language queries, and 40+ visualization types — no coding required.

Reporting & Alerts
Schedule automated reports from Airtable data. Email PDF dashboards, Slack notifications, and webhook triggers when data conditions are met in your bases.

Cloud & On-Premise
Deploy on Knowi's SOC2 Type II compliant cloud or on-premise within your infrastructure. Full data sovereignty with the same analytics capabilities.
Agentic BI for Airtable
Go beyond dashboards. AI agents that understand your Airtable data, answer questions in plain English, and take action automatically.
Natural Language Queries
Ask "show me overdue tasks by assignee this month" and get instant results from your Airtable base. The AI pulls the right data and builds the visualization automatically.
AI-Powered Insights
Agents detect patterns in your Airtable data — bottlenecks in project timelines, anomalies in inventory levels, trends in pipeline velocity — and surface them proactively.
Auto-Generate Dashboards
Describe what you need: "create a project tracking dashboard showing status breakdown, timeline adherence, and team workload." The agent builds it from your Airtable data.
Multi-Agent Orchestration
Complex requests trigger multiple specialized agents. "Pull project data from Airtable, correlate with revenue in PostgreSQL, and build a profitability dashboard" — handled end to end.
Semantic Search
Search across all your dashboards, widgets, and datasets by meaning — not just keywords. Find the analysis you need in seconds across every connected source.
Automated Delivery
Schedule reports to Slack, Teams, or email with natural language. "Send the project status dashboard to #operations every Monday at 9am" — done.
Embed Airtable Analytics in Your Application
Why Knowi for Airtable Analytics
See how Knowi compares to Power BI, Tableau, Zoho Analytics, and Looker for Airtable analytics
Scroll right to see all columns →
| Feature | Knowi | Power BI | Tableau | Zoho Analytics | Looker |
|---|---|---|---|---|---|
| Native Airtable Connection | ✓ | 3rd party | 3rd party | ✓ | ✗ |
| Cross-Source Joins (NoSQL, SQL, APIs) | ✓ | ✗ | ✗ | Limited | ✗ |
| Natural Language AI Queries | ✓ | Copilot | Ask Data | Zia | ✗ |
| White-Label Multi-Tenant Embedding | ✓ | Limited | ✗ | Limited | ✗ |
| Server-Side Airtable Formula Filters | ✓ | ✗ | ✗ | ✗ | ✗ |
| Self-Service for Business Users | ✓ | ✓ | ✓ | ✓ | Limited |
| Agentic BI with Multi-Agent Orchestration | ✓ | ✗ | ✗ | ✗ | ✗ |
| 40+ Visualization Types | ✓ | ✓ | ✓ | ✓ | ✓ |
| On-Premise Deployment | ✓ | Gateway | ✓ | ✓ | ✗ |
Frequently Asked Questions
Common questions about Airtable analytics and business intelligence
Knowi is the best BI tool for Airtable. It connects natively via the Airtable REST API, joins Airtable data with SQL databases, MongoDB, REST APIs, and 30+ other sources without ETL, provides AI-powered natural language queries, and offers white-label embedded dashboards for SaaS products. Unlike Power BI or Tableau, Knowi requires no third-party connectors or middleware.
Yes. Knowi joins Airtable data with PostgreSQL, MySQL, Snowflake, MongoDB, Elasticsearch, REST APIs, and 30+ other sources in a single query — no ETL pipelines or data movement required. This is Knowi's core differentiator vs tools like Power BI and Tableau which only connect to one source at a time or require a data warehouse.
Knowi connects to Airtable via the official REST API using a Personal Access Token (PAT). Generate a token in Airtable's Developer Hub with the scopes you need, paste it into Knowi, and start querying immediately. No ODBC drivers, no middleware, no third-party connectors. Configuration takes under two minutes.
Yes. Knowi provides white-label embedded analytics for Airtable data. Embed dashboards via iframe or JavaScript SDK with SSO integration, row-level security, multi-tenant data isolation, and full custom branding. Your customers see your brand, not Knowi. Deploy on SOC2 Type II compliant cloud or on-premise within your infrastructure.
Airtable caps tables at 100,000 records (250,000 per base on Enterprise), offers limited chart types through Interface Designer, cannot join data with external databases, has no SQL access, and limits API requests to 5 per second per base. Knowi removes these constraints — query unlimited data across Airtable and 30+ external sources, use 40+ visualization types, and apply SQL-like Cloud9QL transformations. For teams outgrowing Airtable's built-in analytics, Knowi is the natural next step.
Neither is a purpose-built analytics tool. Airtable excels at structured data management with relational tables, while Google Sheets is better for ad-hoc calculations and collaboration. For real analytics — dashboards, cross-source joins, scheduled reporting, and embedded visualizations — use a BI tool like Knowi on top of both. Knowi connects to Airtable and Google Sheets simultaneously and can join data from both in a single query.
Airtable's built-in charts are limited to data within a single base and offer basic chart types. Knowi provides 40+ visualization types, cross-source joins with SQL databases and APIs, AI-powered natural language queries, scheduled reporting with email and Slack delivery, and white-label embedding for customer-facing analytics. Knowi is built for production BI; Airtable charts are for quick internal views.
Yes. Knowi's AI-powered analytics lets business users ask questions in plain English — "show me task completion rate by team this month" — and get instant visualizations from Airtable data. No API knowledge or coding required. The drag-and-drop interface also lets non-technical users build dashboards without writing queries.
Yes. Schedule automated data pulls from Airtable at any interval — every 15 minutes, hourly, daily, or weekly. Knowi stores the results and delivers dashboards via email PDF, Slack, Microsoft Teams, or webhook. Set data-driven alerts to trigger notifications when specific conditions are met in your Airtable data, like overdue tasks or inventory below threshold.
Start Building Airtable Dashboards Today
Native API connection. Cross-source joins. AI-powered analytics. White-label embedding. Free 21-day trial.

Don't lose your mojo
Contact us to convert your trial account!
-
Product
Dashboards & VisualizationsEXPLORE
![arrow]() Embedded AnalyticsEXPLORE
Embedded AnalyticsEXPLORE![arrow]() AI AnalyticsEXPLORE
AI AnalyticsEXPLORE![arrow]() Agentic BIEXPLORE
Agentic BIEXPLORE![arrow]() Unified DataEXPLORE
Unified DataEXPLORE![arrow]() Document AIEXPLORE
Document AIEXPLORE![arrow]() Not sure where to start? Give us a call and our support team will help find the right product for you
Not sure where to start? Give us a call and our support team will help find the right product for you - Why Knowi
- Pricing
- Resources
 Datasources
 Knowledge Center
 Video Tutorials
 Security
 About Knowi