Data Engineering Trends You can’t Ignore
Read on to know about the next wave of data engineering tools and techniques that are reshaping the industry standards and driving innovation.

Read on to know about the next wave of data engineering tools and techniques that are reshaping the industry standards and driving innovation.
Gen AI revolutionizes data analytics by automating data interpretation, and generating insights, allowing organizations to fully leverage their data.
Learn about Data Mesh, a strategic framework that is reshaping how businesses approach data architecture, management, and analytics.
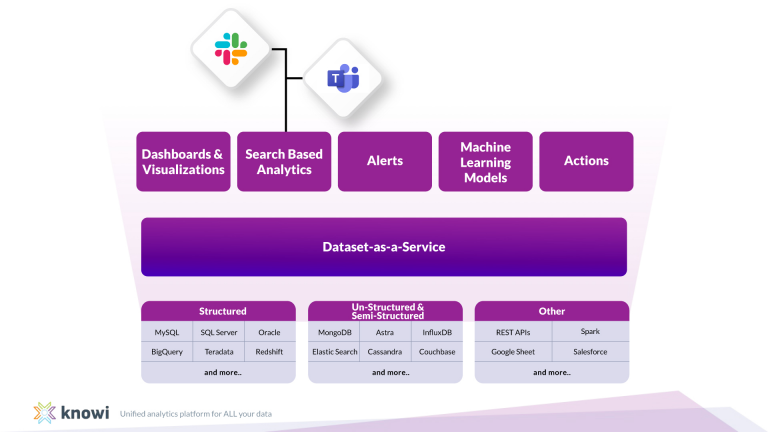
Learn about Data Fabric, a data management methodology that helps you with unified access to all your data, simplifies management and unlocks insights.
TL:DR A REST API (Representational State Transfer Application Programming Interface) is a standardized way for applications to communicate and exchange data over the web. It

If you’re venturing into the world of databases, chances are you’ve already heard of MySQL and its reputation as a powerhouse of data management. MySQL,
In the dynamic landscape of 2023, businesses are no longer just powered by people; they’re propelled by data. The rise of data-driven decision-making has transformed
Introduction to MongoDB Charts MongoDB Charts is a solution to visually represent MongoDB data, offering an intuitive interface for creating, sharing, and embedding visualizations. In

A simple google search will yield all sorts of detailed guides on SQL join types. Many of these guides are overwhelming with detail or assume
Introduction to Cohort Analysis Cohort analysis is an analytical tool used to understand customer behavior and improve customer engagement and retention. This type of analysis