Are you fed up with complex ETL processes and the tools they require?
Knowi is a BI tool equipped with best-in-class capabilities that remove the complexity involved in data extraction, transformation, and loading into data warehouses.
With this modern enterprise tool, it is possible to reduce the distance from raw data to foresight to action.
In this article, we will explore:
- A Glimpse Into Knowi
- Foundations of Data Engineering in Knowi
- Query Generation
- Multi-Data Source Joins
- Business User Use Cases
- Conclusion
A Glimpse Into Knowi
With a robust data engineering layer and native integration with SQL, NoSQL databases, APIs, files, cloud-based services, and multi-source join support, Knowi eliminates the need for ETL, ODBC drivers, etc.
Data engineers can easily connect to any of these data sources (and more) to create blended data sets and instantly visualize the results. Moreover, they can apply machine learning algorithms, share dashboards with business users, embed results in data applications, or trigger actions to other downstream applications or notification systems.
Foundations of Data Engineering in Knowi
The query section strengthens the data engineering layer in Knowi and is powered by a lot of powerful capabilities as listed down below:
- Data exploration
- Query generation capabilities
- Creation of data models and dashboards
- Execution of native Queries across various data sources
- Join multiple Data Sources on the fly without traditional ETL processing
- Optional transformations via UI or Cloud9QL
- Directly run queries in real-time against your database
- Schedule query executions
- Apply Machine Learning models on the Query
- Ask ad hoc questions in plain English using NLP
Query Generation
When you select your data source, a list of collections/tables along with field samples is automatically detected in the Data Explorer. This helps you easily generate your Query by either using the Visual Builder or by writing the query directly into the Query Editor.
The results of the queries (direct as well as non-direct) form a dataset that can be reused as inputs to other queries. Based on the results of queries, you can now create multiple visualizations.
Multi-Data Source Joins
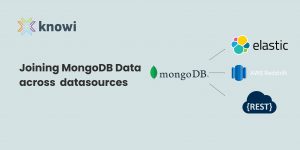
Knowi enables joins across the same or different data sources to smoothly analyze and store combined outcomes.
Let’s have a look at an example:
If we connect two databases: one MongoDB and another MySQL database, the queries can be defined across each one in their native querying language. We can either write those queries directly or use Visual Builder to create them.
The end result is a joined resource set across both of those databases using a key across them.
You can then add calculated fields and transform them further. In the end, you will have three options-
- You can set it to run in real-time against the database;
- You can store the results directly into Knowi and have incremental updates on it;
- You can write it into your own data warehouses such as Snowflake or Redshift.
Once you save it, a dataset is formed which is where all the magic happens. It abstracts all the complexity of the underlying data, provides security governance, and is reusable.
You don’t have to repeat yourself every time and it’s also ready for business users to use.
Business User Use Cases
Creating a Visualization
When a dataset is formed, a visualization/widget gets automatically created by Knowi. There could be more than 1 widget derived from the same dataset. There are some steps to follow to create a widget and add it to the dashboard.
Search-Based Analytics
Knowi’s search-based analytics feature is a great feature for business users. You can ask a question in plain English to get insights and visualizations. Knowi translates your natural language question to a Cloud9QL statement to resolve your query.
Machine Learning Workspace
An ML workspace is a kind of folder that contains all of your subsequent machine learning models (Classification, Regression, and Time-Series Anomaly Detection). To create your own models and integrate your current data with the models you’ve created, you may use a collaboration tool like Slack or Microsoft Teams.
Knowi has tight integration with each application– not only can you send alerts and dashboards to it but you can also access any of your data right within slack.
For example, you can request the latest dashboard on demand from Slack ahead of a meeting. You can also ask questions against any of your data and immediately receive a visualization as a response.
BI Capabilities
Knowi offers best-in-class BI capabilities. If you want alerts or anomaly detection, you can set up an anomaly detection alert.
You can also take anything you’ve created in Knowi and embed that as part of your applications including dashboards, the natural language search bar, as well as widgets.
Conclusion
That’s all about Knowi’s capabilities. With it, you neither have to move the raw data from different sources nor have to use multiple tools to join data across data sources to transform them. Data is made immediately accessible and ready for the business user with Knowi.


