
This is a 10 minute, hands-on tutorial of setting up connectivity to MongoDB Atlas and building visualizations from it using Knowi. The end result is a dashboard of restaurants near the NYC area. In a previous post, we reviewed MongoDB Atlas.

CONNECTING
This assumes that you have an Atlas account setup. If you don’t, go to the MongoDB Atlas page and sign up for a free sandbox account. (More details on setting up your database on Atlas here).
1. Importing data into Atlas:
- Download the sample restaurant JSON dataset.
- Use MongoHub or mongoimport to import the JSON file into a collection.
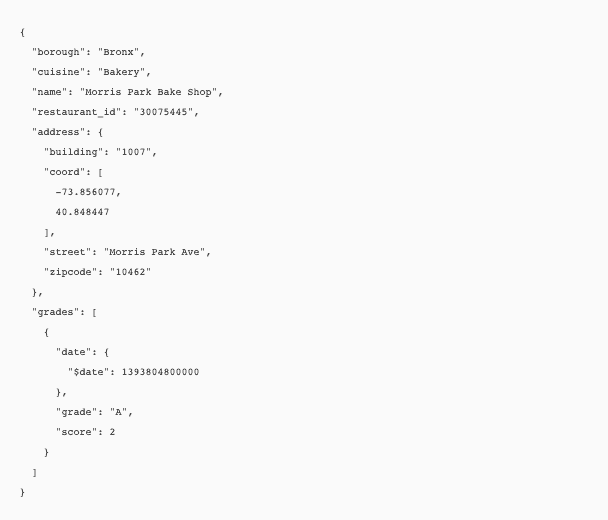
The JSON structure looks like this, with some nested elements:
2. Sign up for a free Knowi account.
3. Create a MongoDB datasource connection:
- Whitelist our IP addresses in Atlas to enable connectivity. (Alternatively, An on-premise way to set up connectivity is also available. See agent docs for more details.)
- Create a new connection in Knowi via the Datasources icon –> New Datasource –> MongoDB.
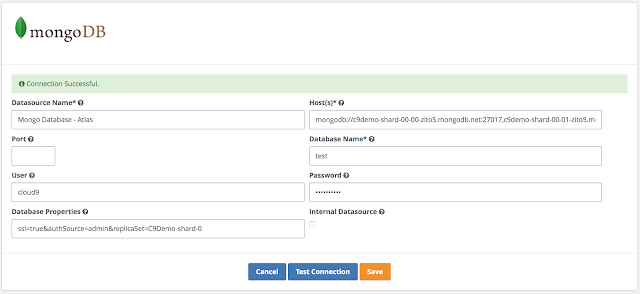
- Add the replicaset hosts into into the Host(s) section. Example: c9demo-shard-00-00-zito5.mongodb.net:27017,c9demo-shard-00-01-zito5.mongodb.net:27017,c9demo-shard-00-02-zito5.mongodb.net:27017
- Leave the port empty, if you already have ports in the hosts section; specify database to connect to, along with the user and password.
- Under the ‘Database Properties’ field, add the following: ssl=true&authSource=admin&replicaSet=<yourRelplicaSetName>
- Use the ‘Test Connection’ button to ensure that the connection is successful. Save.
Now the fun begins. Let’s bring this data to life.
GENERATING QUERIES
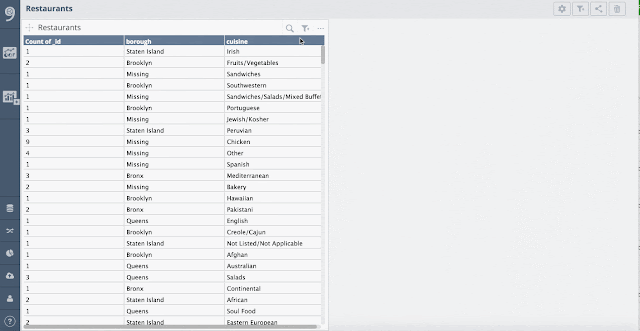
After the datasource is saved, click on the Configure Queries link. This will open up the query page. Let’s start with a count of restaurants by borough by cuisine.
- Open up the Query Generator.
- Collections should be automatically populated with the collections from Atlas. Choose Restaurant collection. This will trigger our field discovery process to determine fields in the collection.
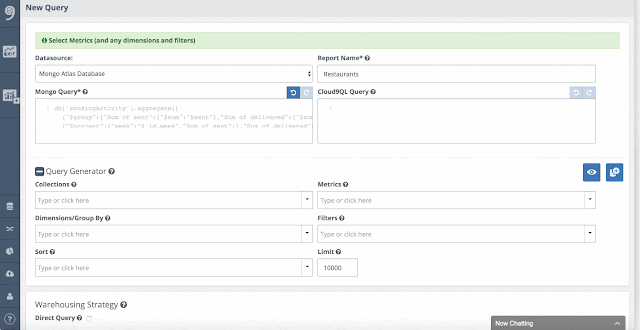
- Add borough and cuisine to the dimensions dropdown.
- Add _id into the Metrics section; click on it to add an count aggregation to it.
- Notice the auto generated MongoDB query with aggregations.
- Click on Preview to instantly preview the results.
VISUALIZATIONS
Create a dashboard and add our newly created report/widget into it:
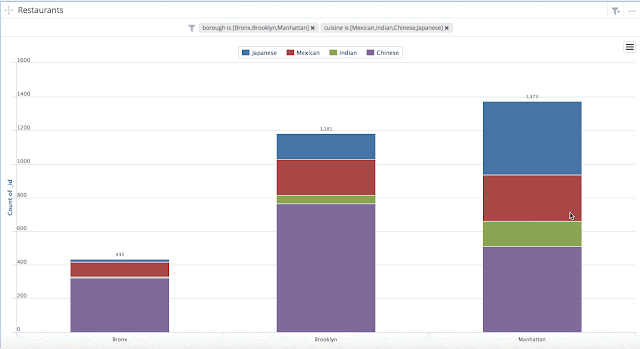
Set up a stacked bar chart with Borough in the X axis, cuisine in the Y axis.
Set up a few filters (via the filter icon):

In a few simple steps, you have your first visualization from data in Atlas.
DRILLDOWNS
Now, let’s take this a step further with a drilldown to produce a cluster map of restaurants for a given ‘borough’ & ‘cuisine.’

Add another query, this time without aggregations and including the nested address object.

Drill into the address object to drag & drop the ‘coord’ array into the ad hoc analysis grid, along with the ‘borough’, ‘cuisine’ and ‘name’:
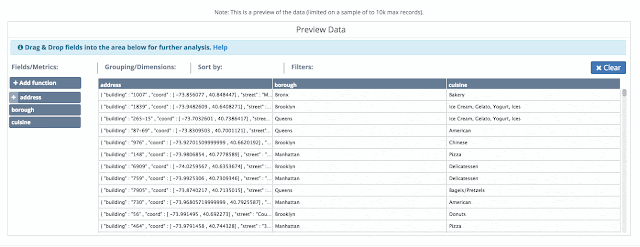
Set it up as a Geo Marker Cluster Visualization. Note that the coord nested array is automatically unwound as lat/long coordinates on the map.

On Visualization settings, set the Name to the restaurant name, and center the map to NYC (Lat/Long of 40, -74). Save the new query/Widget.
Setup a drilldown from our parent bar chart into the map.

Click on any point on the bar chart to get a cluster map of restaurants for the clicked combination ‘borough’ & ‘cuisine’:
SUMMARY
To summarize, we imported data into an Atlas cluster, connected to it using Knowi, generated a few native MongoDB queries on it and set up a few visualizations from it.
Now it’s your turn to bring your own data to life!
RESOURCES