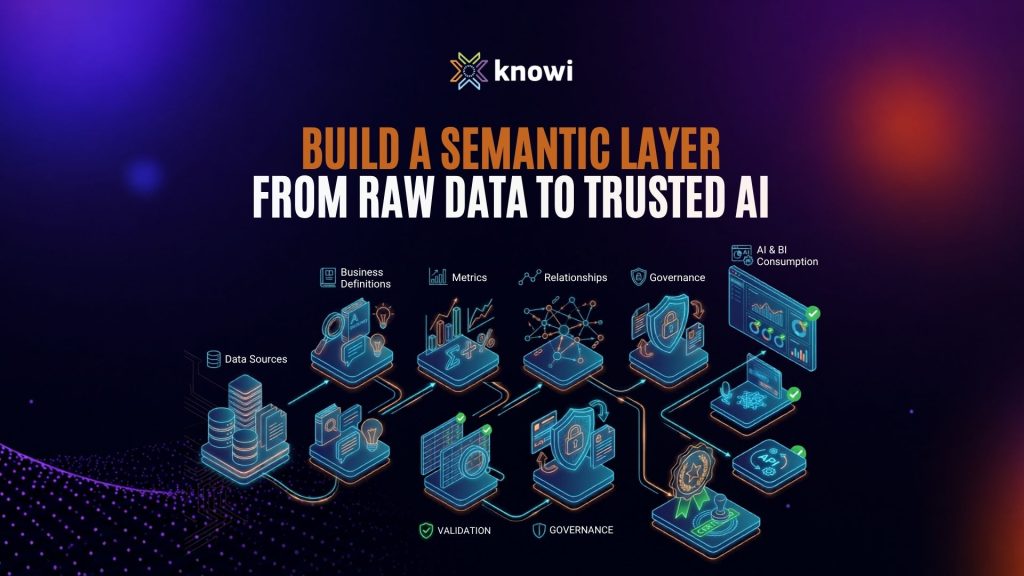
How Embedding with Knowi can Elevate your Web Pages and Apps

Knowi’s visualization tools are not only useful for internal reporting, but are also capable of presenting dashboards and widgets to external sources. This can be done through a variety of sharing options but one of the most powerful methods is through embedding. In this blog we will explore the benefits of this feature, the various types of embeds, and a simple 8 step tutorial on how to create a basic embedded widget.

Illustration of a semantic layer connecting raw data sources to AI assistants, dashboards, and business applications through governed metrics and business context.

What Is a Semantic Layer? The 2026 Guide

A semantic layer is a governed, machine-queryable map of business meaning over your data. What it is, the 4 architectures, and why AI made it essential.

DynamoDB data visualization tools

DynamoDB data visualization tools

Leading DynamoDB data visualization tools in 2026 include AWS QuickSight, Power BI, Tableau, Grafana, and Knowi. QuickSight commonly reaches DynamoDB…

Qlik alternatives

Qlik Alternatives 2026: 4 Platforms Compared

Leading Qlik alternatives in 2026 include Microsoft Power BI for integrated Microsoft ecosystems, Tableau for visual exploration, ThoughtSpot for…

Row-Level Security in Embedded Analytics

Row-Level Security in Embedded Analytics

Row level security embedded analytics means restricting data access at the row level within integrated applications: each authenticated user sees…

Looker pricing 2026

Looker pricing 2026

Looker pricing 2026
Looker pricing 2026 typically starts with a baseline platform fee of $60,000 annually, excluding per-user licenses and warehouse…