Recently, we held a webinar with our friends at Ocean9 focused on-demand, self-serve analytics on large scale datasets. We needed a large dataset for our demo, for which we turned to New York City Taxi data, nicely put together on github by toddwschneider. Plus, it was opportune time for me as I’m headed to New York City this week with lots of cab rides in between meetings.
The dataset consists of trip details of 1.237 billion rides (237GB on disk of RAW CSV data).
STACK
We used the following:
SAP HANA: In-memory, relational database. Given its in-memory architecture, it provides fast lookups on large scale datasets (but by no means cheap).
Ocean9.io: Database-as-a-Service for SAP HANA that enables one click deployment in the cloud.
Cloud9 Charts: Our analytics platform.
This setup enables to do the analysis all in the cloud, with nothing to install (and tearing it down post-analysis).
DATA IMPORT
Frank Stienhans, CTO at Ocean9, has put together a nice blog post on the data import process into HANA. It’s definitely worth a read if you are thinking of using HANA in the cloud.
The import process took approximately 60 minutes into a R3.8xlarge instance on AWS using Ocean9.
ANALYSIS
After the data was loaded, we connected to it directly using Cloud9 Charts, which features a full HANA integration, including point-and-click HANA specific SQL query generation.
Example query:
SELECT avg(total_amt), avg(tip_amt) FROM nyc.yellow
Took 1 sec to return. Not too shabby for a query touching 1.2 billion records.
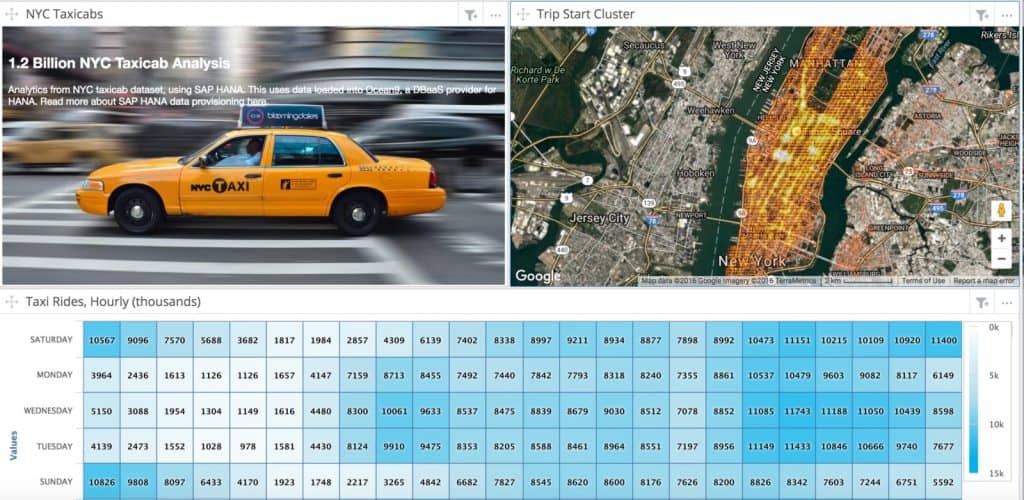
So let’s turn to some analysis. You can find the full interactive dashboard here: https://cloud9charts.com/d/1.1-Billion-NYC-Taxi-Dataset-Analysis
Trip Geo Clusters
Pickups are heavily concentrated around Manhattan (midtown in particular), as well as JFK and La Guardia.
Day/Hour Trends
Heatmap of trips by day by the hour of day:
A few observations:
Peak times are 6–10PM and 8–10 AM weekdays, but notice the dip between 4–5PM. This was a but puzzling to me at first as you’d expect more trips during rush hour. Turns out that around 5PM is when the shift change occurs where cab drivers are heading back to the garage. It might be a bit harder to hail a yellow cab during that time.
Monthly Trends & Predictions
The chart below plots the following:
- Total Monthly Rides since 2009 (Blue)
- 3 Month Moving Average (Green)
- Predicted Values (Yellow). This uses Cloud9 Charts’s prediction modelsout of the box that’ll automatically backtest the data to select the best model.
According to the data, trips have gone from a peak of almost 16 million trips in May 2012 to a low of 11m in Feb 2016, which also coincides with the rise of Uber, Lyft and Green Cabs in NYC.
However, the prediction model values (in yellow) indicates that the downtrend appears to have stabilized, with a slight uptick expected over the next year.
SUMMARY
This particular taxi analysis just scratches the surface: ride data is not just about going from point A to B, but in some ways provides a pulse of the city itself. Time permitting, I’ll put together more detailed analysis of the data in future posts.
The convergence of cloud, optionality in database types for the right workload, infrastructure provisioning using a Database-as-a-Service, with an Analytics-as-a-Service drastically accelerates the time to insights to make self-service analytics a reality.


