
Introduction
Knowi is a unified analytics platform that seamlessly integrates with structured and unstructured data sources. Datasets can be joined, saved, and reused for meaningful downstream self-service analytics. This guide will help you get started with the platform in just a few minutes.
Sections
- Quick Start
- Data Engineering & Reusing Datasets
- Dashboards & Visualizations
- Filters
- Drilldowns
- Self Service Analytics
- Query Runtime Parameters
- Additional Resources
Quick Start
In this Quick start example, we’ll use the UI to connect to our pre-configured MongoDB database in the cloud and create a query. We’ll then use the dataset created from the query to create your first visualization.
Example:
Connect your Datasource
- Sign of for a free Knowi account here
- Once logged in, Click Queries, then click New Datasource +
- Select MongoDB from the list of datasources. Pre-configured settings are available to access our Knowi demo MongoDB database
- Give your datasource a name, test connection, then Save
- Click Start Querying to query your datasource
Creating a Query
After connecting your datasource, Knowi will automatically pull a list of collections (or tables for relational databases) along with field samples. You have the option to auto-generate queries using the Query Builder, or write them directly in the Query Editor. In this example, we’ll use the Query Builder to query the sendingActivity collection.
- Once in the Edit Query page, expand the Data Explorer on the left. This lists all collection and corresponding fields within your datasource
- Expand the “sendingActivity” collection
- Drag the field “bounced” into Metrics. Drag the fields “customer” and “date” into Dimensions/Group By. Apply a sum operation to “bounced”
- Click Preview on the bottom left to preview the results of your query
- Give your query a name, then hit Save & Run Now
- This creates a brand new reusable dataset from your query that can be used for downstream analytics
Creating a Visualization
Now that you’ve written your query, it’s time to create your first visualization. In the following steps, we’ll create a new dashboard and drag the dataset widget you created into the dashboard and create a stacked column chart.
- On the left-hand side panel, click Dashboards
- Hit the + icon to create a new dashboard and give it a name then click “OK”
- Drag the dataset widget you just created into the dashboard. By default, it will be in grid form
- On the top right corner of the widget, click the Context Menu (3-dot icon), then click Settings
- In the Visualization Type dropdown, select Stacked Column
- Click Save, and Close the Settings window
In a few simple steps, we’ve connected, discovered and visualized data from MongoDB.
Data Engineering & Reusing Datasets
In the following examples, we’ll go over reusing existing datasets, joining across multiple datasources, and learn about Knowi’s data model.
Reuse existing queries & results/models
Once a query is saved, it creates a virtual dataset that is tracked and stored in Knowi’s Elasticstore data warehouse and can be reused. You can then create a new “Child” query that takes a subset of the original “Parent” query and save it as a new, derived dataset.
Example:
- In the Queries & Data Sources page, go to an existing dataset and click the Context Menu (3-dot icon) on the far right side of the dataset
- In the menu, select Add a Linked Dataset. This takes you to the Select Datasoure page
- Notice, the UI is identical to the Edit Query page but with a few differences:
- The Knowi Data Warehouse is selected as the Datasoure by default
- The original, or “Parent” dataset is selected as the Dataset by default. This is because the query you will be creating is being derived from the “Parent” dataset
- Select fields, add groupings and aggregations as needed
- Under Warehousing Strategy, check the Triggered Query box. This will ensure that every time the “Parent” query runs, this query will be “triggered” to run also
- Give the query a name, then click Save & Run Now
Multi-source joins
Knowi facilitates seamless joins across disparate data sources such as SQL, NoSQL, REST-API’s, and flat files sources. You can also join across different tables/collections/indexes within the same datasource. This example assumes you have already connected to two or more datasources.
Example of Joining a MongoDB and MySQL datasource:
- In the Queries & Data Sources page, click New Query +
- Select your 1st datasource from the list of datasources you’ve connected to
- In the dropdown, choose the table/collection you want to query. Select fields, add groupings and aggregations as needed
- On the bottom-left corner of the screen, click Join
- In the Datasource dropdown menu, select your 2nd datasource you want to join with
- In the dropdown, choose the table/collection/index you want to query. Select fields, add groupings and aggregations as needed
- Click Join Builder. This opens the Join Fields popup window
- Select the JOIN TYPE
- Select the key Join Fields from the 1st datasource (Left Field) and 2nd datasource (Right Field), then Save
- Preview to see the results of the combined dataset
- Give the query a name, then click Save & Run Now
Queries/Datasets/Widgets
Knowi has three main asset types: Queries, Datasets, and Widgets. This section briefly discusses each, and how they map to one another in the hierarchy.
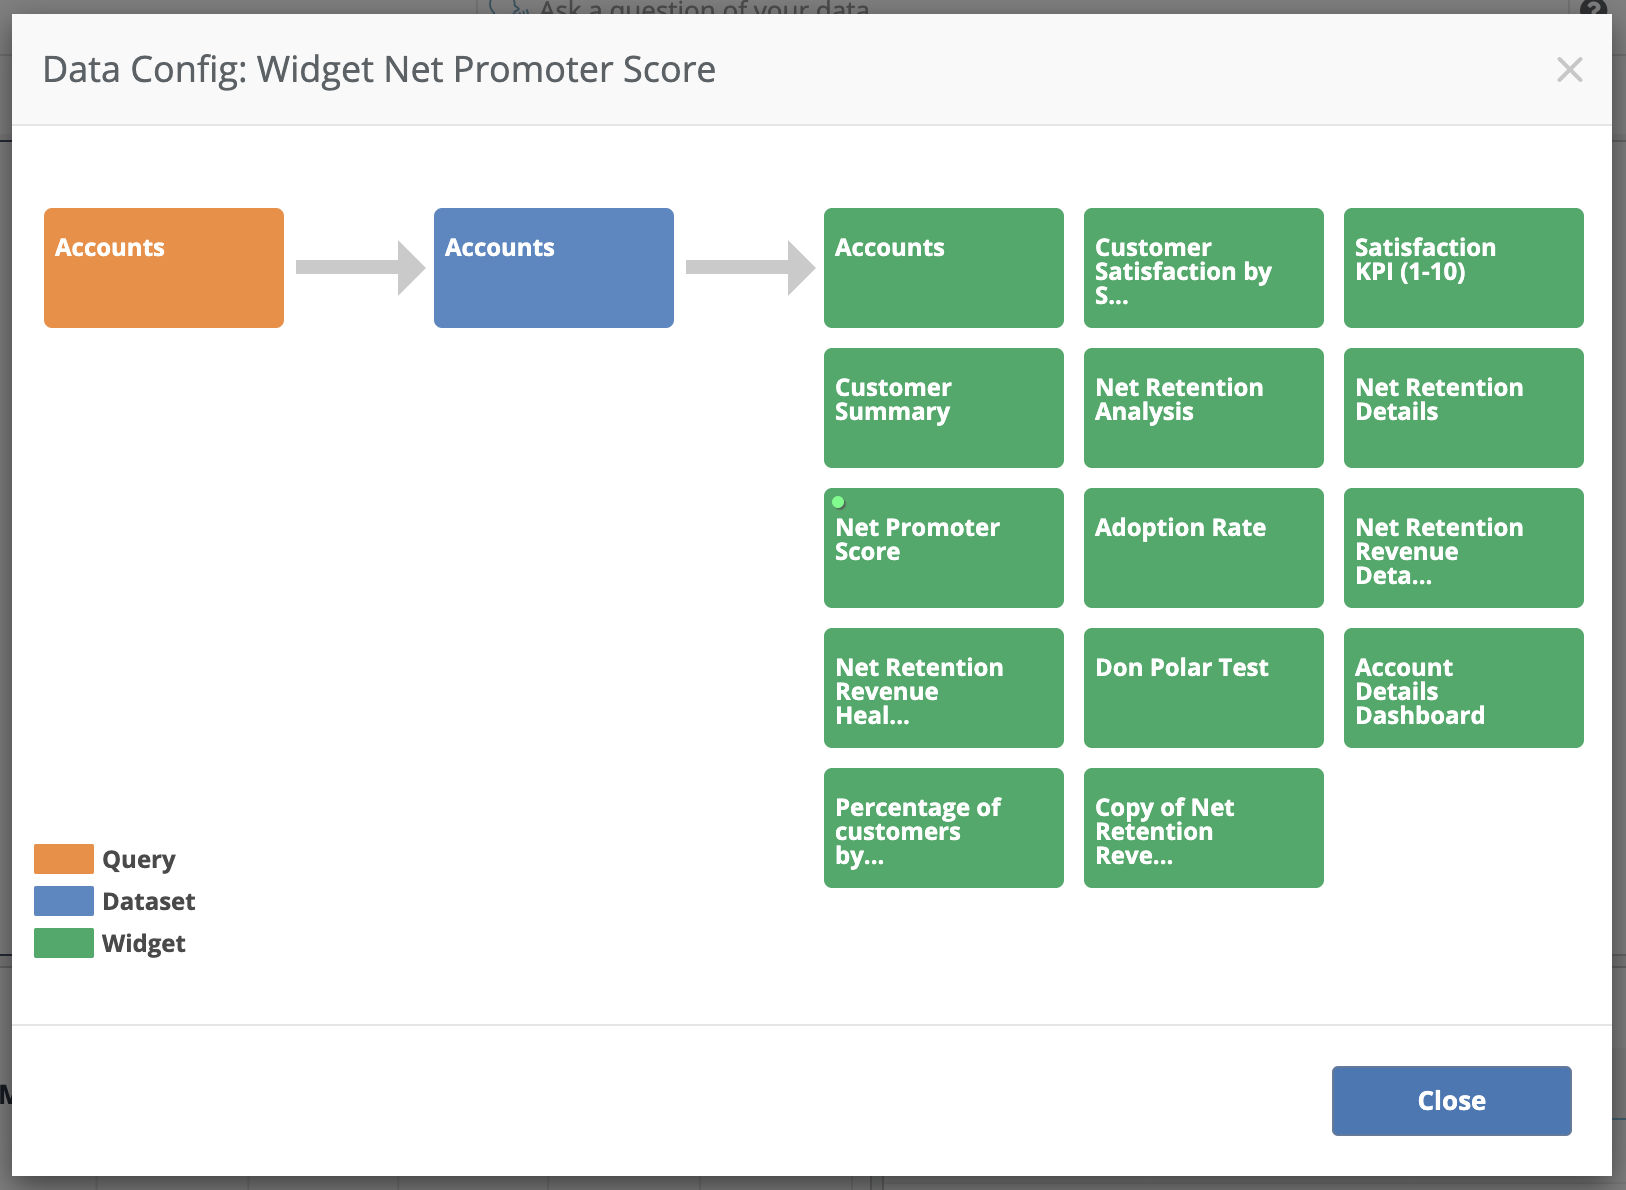
Queries: The mechanism by which you interact with your datasource. Queries can be created and edited in the Edit Query page. Once a query is saved, the results are cached and stored in Knowi’s Elasticstore data warehouse and becomes a Dataset.
Datasets: A logical grouping of data, typically from the results of a query. Datasets are reusable, can be joined with other datasets, and serve as the foundation for widgets used for visualization.
Widgets: A widget is a visual representation of a dataset. One or more widgets can point to the same dataset.
A dataset and widget is automatically created by Knowi when a query is created.
Dashboards & Visualizations
Once a query is created, a corresponding dataset and widget is also created. Once you create a dashboard, you can drag the widget into it and create one or more visualizations.
- After creating a query, the dataset will appear in the Queries & Data Sources page
- To create a dashboard, click the Dashboard icon on the sidebar menu, then click the + icon
- Give the dashboard a name, then click “OK”
- Click the Widgets icon on the sidebar menu. Select and drag a widget into the dashboard
- To change the type of visualization, click the More Settings icon on the top right of the widget, then click Settings
- In Visualization Type dropdown, select the visualization to use, then Save
- To clone a widget, click the More Settings icon on the top right of the widget, then click Settings
- Click Clone (blue button)
- Give the new widget a name, then click Clone
- Once the clone is successful, click Add to Dashboard
Filters
Knowi dashboard filters enable the user to slice and dice the data on their dashboard, across all widgets, how and when they choose. Filter types include auto suggestions, multi-value filters and date ranges.
Example of adding a multiple value filter and a date range slider filter onto a dashboard:
- In the top-right corner of the dashboard, click the Filter icon
- In the Filters sidebar, click + Add, then select Filter
- Select the field you want to filter on and the filter Condition type (default is “Equals”)
- Click Save. The filter will now appear in the top left of the dashboard
- Repeat steps to add multiple filters
Drilldowns
Drilldowns allow your users to visually navigate and analyze data in powerful ways. They can be set into another widget, another dashboard or the same dashboard, and can be any levels deep with support for drilldown modes with mix and match.
There are three types of drilldowns:
- Dashboard: Interacting with a widget will bring the user to the configured dashboard based on settings
- Connected Widgets: Filters the current dashboard with settings based on the clicked points
- Widget: When interacting with a widget, the user will stay in the same dashboard but the current widget will change to the configured widget, with any associated filters
Example of creating a Connected Widgets drilldown:
Self Service Analytics
Knowi’s Self Service Analytics allows users to easily interact with their data. Users can ask their data questions in plain English and get results instantly, or use Knowi’s drag and drop interface to organize data.
Ask Questions on a single Dataset
Example:
- Navigate to any widget on a dashboard
- Click the Natural Language/Self Service Analytics icon
- In the search bar, type a question from your data (i.e. “Total Emails Delivered by Customer Weekly”)
- Knowi will automatically select fields, group, and perform aggregations on your data based on your question
- Click the Visualization tab, then choose a Visualization Type form the drop down to represent your data
- Click Save
Ask Questions across multiple Datasets
Example:
- In any dashboard, go the search bar at the top
- In the dropdown to the right of the search bar, make sure Datasets is selected
- Enter your question. As you type, the name of potential dataset matches to ask your question from will populate
- Select the dataset you want to ask a question from. This takes you to the Self Service Analytics screen
- Knowi will automatically choose fields, group, and perform aggregations on your data based on your question
- Click the Visualization tab, then choose a Visualization Type form the drop down to represent your data
- To create a new widget from the visualization, click Create Widget +
- Give the widget a name, then click +Create
Drag & Drop fields, add new fields/calculations, and multi-step transformations
Knowi’s Self-Service Anlytics allows you to drag & drop fields, create calculated fields, and use a multi-step approach to organize your data. This example uses the sendingActivity dataset, where we’ll grab fields, add aggregations, create calculated fields to get the percentile and bounce rate, over multiple steps.
Example:
- Navigate to the widget on a dashboard
- Click the Natural Language/Self Service Analytics icon
- Drag the “bounced” field to Field/Metrics. Under Operation, select Sum
- Drag the “customer” field to Grouping/Dimensions
- Drag the “sent” field to Field/Metrics. Under Operation, select Sum
- To get the percentile of the “sent” field, click + Add Function
- In the pop-up window under Operation, type “percentile” and select the PERCENTILE function
- Enter “sent” as the field, and enter a percentile (i.e. 75)
- Give the function a name, then click OK
- To lock in your changes and proceed to the next step, click Steps, then select Add Step +
- To get the bounce rate, click + Add Function
- Under Operation, manually enter the calculation: round(bounce/sent)*100, 2), then click OK
- Drag “All” to Field/Metrics to add the rest of the fields
Query Runtime Parameters
Query Runtime Parameters allow users to apply dynamic parameters into a Direct query through filters on a dashboard. For example, if you have a runtime parameter in your query for the field “Customer” and you have a runtime filter for this field on your dashboard, the query will run and return data for a specific customer name value you input.
Creating a Query Runtime Parameter
This example assumes that you’ve connected to a MongoDB datasource. We’ll be using the sendingActivity collection to create a query runtime parameter for the field “Customer”.
Example:
- In the Queries & Data Sources page create a new query from your MongoDB datasource
- In the Collections dropdown, select sendingActivity
- In the Metrics dropdown, select “customer”, “message_type”, and “clicks”
- Under Warehousing Strategy, check the Direct Query box
- In the Filters dropdown, select customer, the Add Filter menu will pop up
- Check the box Configure as runtime parameter (direct queries only)!
- Select “Equals” as the Condition
- Under Parameter Name, give your parameter a name (i.e. customer_name)
- (Optional) Enter a Default value for your parameter (i.e. “Facebook”).
- This will be the default customer value that will be selected and data returned for when the query runs
- If no default value is selected, you will have to enter a value from the customer field in order for data to be returned
- In this example, we will *not* select a default value
- Give your parameter a Label (i.e. CUSTOMER). This is how it will be displayed when used as a filter
- Click Preview. You will be prompted to enter a value for your parameter. Enter a customer name (i.e. “Facebook”) and click “OK” to preview
- Give your query a name, then Save
- Create a new dashboard and drag the widget created from your query into it
- Add a dashboard filter, and select the label for the runtime parameter you created as the Field to Filter. Under Filter Control, choose Single, then Save
- In the newly created dashboard filter, enter a customer name value (i.e. “Facebook”)
- The filter will dynamically pass this value into the query, and return data only for that customer name value
User inputs & input suggestions from another dataset
Users can also pass values from another dataset into the runtime parameter. Continuing from the example above, we’ll create a new linked dataset from your original runtime query. Then use the values in this query as inputs to pass through the runtime parameter.
Example:
- Return to the Queries & Data and create a new query by selecting your mongoDB datasource
- Under Measures and Groups, select the field “message_type”
- Under Dimensions/Group By, select “message_type” as well
- Preview the query. You should only see the values “Marketing” and “Transaction” under the field “messager_type”
- Give your query a name, then click Save & Run Now
- Back in your runtime dashboard, click the Filter icon to add a new filter
- Toggle on the option Set Auto suggestion from another dataset
- In the dropdown, select the linked dataset you just created, then Save
- Now, you can filter your dashboard by message type, based on the values from your liked dataset