TL;DR
Traditional BI tools like Tableau or Power BI are great at reporting structured data – but they miss the relationships between entities.
Graph analytics changes that by mapping data as a network of connections (nodes and edges), revealing hidden relationships, patterns, and influence.
From fraud detection in finance to product recommendations in e-commerce, graph analytics brings context to metrics.
And with unified analytics platforms like Knowi, you can combine relational, NoSQL, and graph insights – no ETL, no complexity – to visualize how your data truly connects.
Table of Contents
- Introduction: The Rise of Connected Data
- What is Traditional BI?
- What is Graph Analytics?
- What is the difference between Traditional BI and Graph Analytics
- Why Graph Analytics Matters for Connected Data
- The Missing Link: Why Most BI Tools Fall Short
- Bringing Graph Intelligence into Your Analytics Stack
- Conclusion: From Tables to Connections
- Frequently Asked Questions
Introduction: The Rise of Connected Data
Data is no longer linear – it’s connected, relational, and complex. From customers interacting across multiple touchpoints to devices communicating within IoT networks, every data point today lives in a web of relationships.
But here’s the problem:
Traditional BI tools like Tableau or Power BI are designed for tables, not networks. They summarize data beautifully – but struggle to reveal how entities are connected.
In a world where customer, product, and transaction data are all interlinked, how well can your BI handle those connections?
This blog explores exactly this. We will explore how graph analytics differs from traditional BI and why it’s essential for understanding today’s interconnected data.
What is Traditional BI?
Let’s start by understanding traditional BI.
Most Business Intelligence (BI) tools (like Tableau, Power BI, or Looker) are built on relational databases – think of data in tables with rows and columns.
Each table is connected by keys (like Customer ID, Product ID, etc.), and you can use SQL joins or drag-and-drop features to combine them.
These tools are great for questions like:
- “What’s our total revenue by region?”
- “How many new users signed up this month?”
- “Which products have the highest sales?”
This works well when your data is clean and structured. But today, data isn’t always that simple – it comes from sensors, social interactions, logs, and APIs that don’t fit neatly into rows and columns. That’s why we call these tools Traditional BI.
In short:
Traditional BI = metrics and summaries across structured, tabular data.
It’s designed for aggregation, not for understanding relationships between entities.
What is Graph Analytics?
Graph analytics looks at data as a network of connected nodes (things) and edges (relationships between those things).
It’s not about tables – it’s about connections.
Think of it like a social network:
- Each person = a node
- Each friendship = an edge
Graph analytics can answer questions traditional BI can’t easily handle, like:
- “Who are the key influencers in this network?”
- “Which customers are most connected to others?”
- “Are there hidden communities or fraud rings?”
It’s about patterns, paths, and relationships – not just totals or averages.
What is the difference between Traditional BI and Graph Analytics
| Aspect | Traditional BI | Graph Analytics |
| Data model | Tables (rows & columns) | Nodes & edges (networks) |
| Best for | Aggregations, KPIs, trends | Relationships, patterns, influence |
| Query style | SQL (join tables) | Graph queries (like Cypher, Gremlin) |
| Common tools | Tableau, Power BI, Looker | Neo4j, TigerGraph, Amazon Neptune |
| Example question | “How many users joined this month?” | “Which users are one connection away from an influencer?” |
Why It Matters for “Connected Data”
Today’s data isn’t just rows of facts – it’s webs of connections:
- People connect to other people (social, org, customer networks)
- Products connect to users (recommendations, transactions)
- Machines connect to sensors (IoT networks)
- IP addresses connect to accounts (fraud detection)
Traditional BI flattens these relationships. Graph analytics preserves and analyzes them.
That’s why many modern BI platforms are starting to integrate graph databases or graph query layers – to bring relationship intelligence into dashboards.
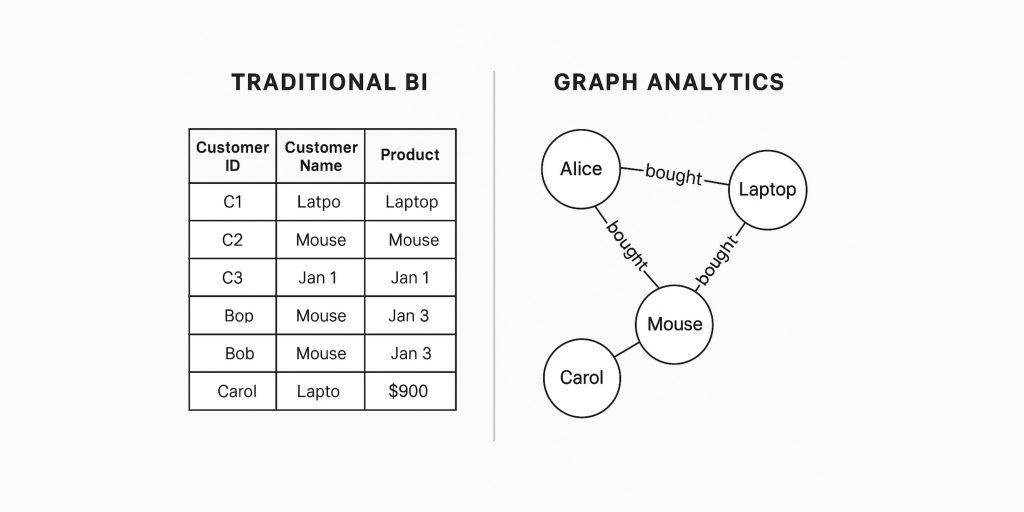
Traditional BI View (Tables)
| Customer ID | Customer Name | Product | Date | Price |
| C1 | Alice | Laptop | Jan 1 | $900 |
| C2 | Bob | Mouse | Jan 2 | $25 |
| C1 | Alice | Mouse | Jan 3 | $25 |
| C3 | Carol | Laptop | Jan 5 | $900 |
In traditional BI, you’d:
- Group by product → get total revenue per product
- Group by customer → get total spend per customer
- Slice by date → see sales trends
Great for summaries, not for connections between people or products.
Graph Analytics View (Nodes + Edges)
Now imagine this same data as a network graph:
Alice - bought - Laptop
Alice - bought - Mouse
Bob - bought - Mouse
Carol - bought - Laptop
Here:
- Each person (Alice, Bob, Carol) is a node
- Each product (Laptop, Mouse) is a node
- Each purchase is an edge (relationship) connecting them

With Graph Analytics, what you can do?
With this model, you can answer:
- “Which customers bought similar items?” (Alice ↔ Bob both connected to Mouse)
- “Who are the most connected products?” (Mouse is a hub – many buyers)
- “Who might buy a laptop next?” (recommendation based on shared product links)
Graph algorithms let you analyze influence, similarity, and patterns that table-based BI can’t see.
Why Graph Analytics Matters for Connected Data
Today’s data is no longer linear or isolated – it’s interconnected.
From IoT sensors transmitting to each other, to customers influencing one another’s purchases, to financial transactions linked through shared entities – our world is made of networks.
Graph analytics is built precisely for that world. It allows you to analyze relationships, not just records.
Business Value of Graph Analytics
- Discover hidden relationships:
Map complex dependencies in a supply chain to identify single points of failure or hidden risk exposure.
Example: A global manufacturer used graph analytics to trace which suppliers were indirectly tied to a sanctioned entity – something traditional joins couldn’t expose.
- Improve predictive models:
Add relationship features (like “connected customers” or “influencer proximity”) to boost model accuracy.
Example: A telecom company improved churn prediction by 18% by analyzing how customers were connected through social call patterns.
- Enable real-time pattern detection:
Continuously monitor connections to spot unusual activity as it happens.
Example: A payments company flags suspicious transaction rings by analyzing how accounts connect to each other in near real time.
Industry Snapshots
| Industry | Use Case | What Graph Analytics Enables |
| Finance | Fraud Ring Detection | Uncover indirect links between accounts or devices to catch collusive behavior early. |
| Telecom | Network Optimization | Identify congested nodes or weak connections for smarter routing and maintenance. |
| E-commerce | Product Affinity | Recommend products based on co-purchases across shared customer networks. |
| Healthcare | Disease Co-occurrence | Detect patterns in patient data where certain conditions tend to appear together. |
The Missing Link: Why Most BI Tools Fall Short
Traditional BI tools – Tableau, Power BI, Looker – excel at reporting but not at relationships.
They operate on flat, tabular models that require extensive ETL, joins, and data reshaping just to approximate the connections graph models handle natively.
The limitations show up fast:
- Each additional join or relationship increases query complexity and slashes performance.
- Network-based questions (“Who’s connected to whom?” or “Which customers influence others?”) are nearly impossible without custom code.
- Maintaining data pipelines for every relationship scenario leads to brittle systems and slow insights.
This is where Unified Analytics Platforms come in.
Modern solutions like Knowi bridge the gap – letting teams blend relational data (for metrics) and graph data (for relationships) into one seamless analytical environment.
That means:
- No heavy ETL to combine data types.
- Faster, relationship-aware insights.
- Real-time exploration across structured and connected data – all in one place.
Bringing Graph Intelligence into Your Analytics Stack
You don’t need to abandon your existing BI ecosystem to leverage graph analytics – the key is integration.
Modern analytics platforms are evolving to combine relational, NoSQL, and graph data under one roof.
Step 1: Connect and Model Data as a Graph
Start by linking entities that share relationships – customers to products, users to transactions, devices to IPs.
Instead of flattening these into tables, maintain their relationships.
Many graph databases like Neo4j, TigerGraph, or Amazon Neptune can plug directly into analytics platforms.
Example: A fraud detection team builds a graph of transactions connecting accounts, devices, and merchants – and then queries it to find suspiciously dense clusters.
Step 2: Apply Graph Algorithms to Surface Insights
Once the relationships are modeled, apply graph algorithms (like PageRank or community detection) to extract new metrics – e.g., influence score, closeness, community membership – that can feed back into your dashboards or machine learning models.
Example: An e-commerce platform calculates each product’s “affinity centrality” score to recommend bundles that customers are statistically likely to buy together.
Step 3: Visualize Relationships Alongside Metrics
Blend graph insights (connections, clusters) with traditional KPIs (sales, churn rate) for a unified view.
Instead of static charts, you get interactive network visualizations that reveal how metrics move through relationships.
Example: A telecom operator overlays customer churn metrics on a graph of call relationships to pinpoint high-risk clusters.
Step 4: Use Unified Analytics Platforms like Knowi
Platforms like Knowi eliminate the friction between relational and graph analysis by:
- Connecting directly to graph databases (e.g., TigerGraph, Neo4j) and NoSQL stores (e.g., MongoDB, Elasticsearch)
- Allowing cross-source joins without ETL
- Supporting natural language queries so users can simply ask, “Which connected customers are most likely to churn next quarter?”
- Enabling embedded visualizations to bring graph insights into products or dashboards.
In short:
Knowi turns connected data into connected insights – without the complexity of managing separate BI and graph systems.
This guide demonstrates graph analytics in action – using Knowi to visualize, explore, and interact with network data such as telecommunications topologies
Conclusion: From Tables to Connections
The way we analyze data is evolving.
In an interconnected world, understanding relationships is just as important as understanding numbers.
Traditional BI tells you what happened – but graph analytics shows you why.
It connects the dots between customers, transactions, suppliers, and systems to uncover patterns that were previously invisible.
Platforms like Knowi make this shift practical – combining AI, NLP, and graph analytics into one seamless environment.
The future of BI isn’t just about better dashboards; it’s about connected intelligence – insights that see the whole network, not just isolated rows.
Frequently Asked Questions
What is graph analytics in simple terms?
Graph analytics is a way to analyze data based on relationships. It uses nodes (entities) and edges (connections) to uncover how things are linked – like people in a social network or accounts in a fraud ring.
How is graph analytics different from traditional BI?
Traditional BI analyzes structured data in tables (rows and columns). Graph analytics focuses on the connections between entities, allowing you to find influence, clusters, or hidden relationships that SQL-based BI can’t easily detect.
When should I use graph analytics?
Use it when relationships matter – fraud detection, recommendation systems, customer churn analysis, supply chain optimization, or network monitoring.
Can graph analytics work with existing BI tools?
Some modern platforms (like Knowi) integrate both graph and relational data, letting you analyze connected data without migrating or rebuilding your BI stack.
What tools are commonly used for graph analytics?
Popular graph databases include Neo4j, TigerGraph, and Amazon Neptune. Unified analytics platforms like Knowi connect directly to these sources and let you visualize or query graph data alongside traditional datasets.


