MongoDB Charts: What It Is, How It Works, And What It’s Used For
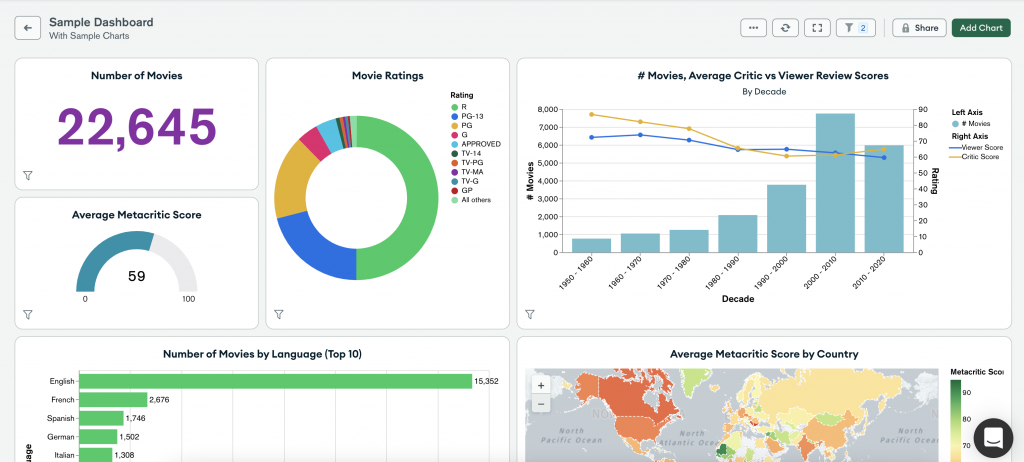
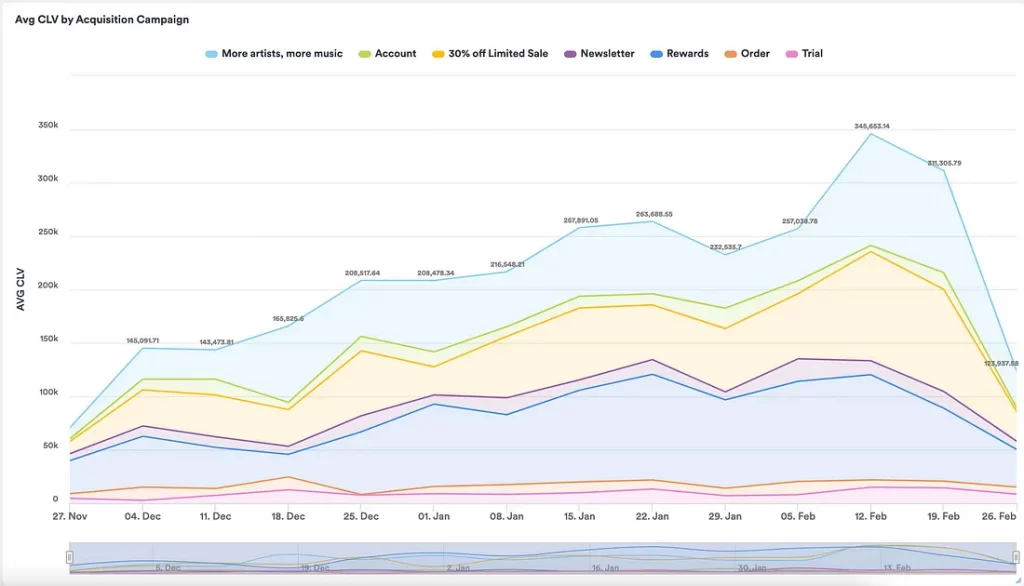
Introduction to MongoDB Charts MongoDB Charts is a solution to visually represent MongoDB data, offering an intuitive interface for creating, sharing, and embedding visualizations. In today’s data-driven world, the ability to transform raw data into actionable insights is essential for decision-making for businesses at every level. MongoDB, a popular NoSQL database, has revolutionized data storage …
MongoDB Charts: What It Is, How It Works, And What It’s Used For Read More »
