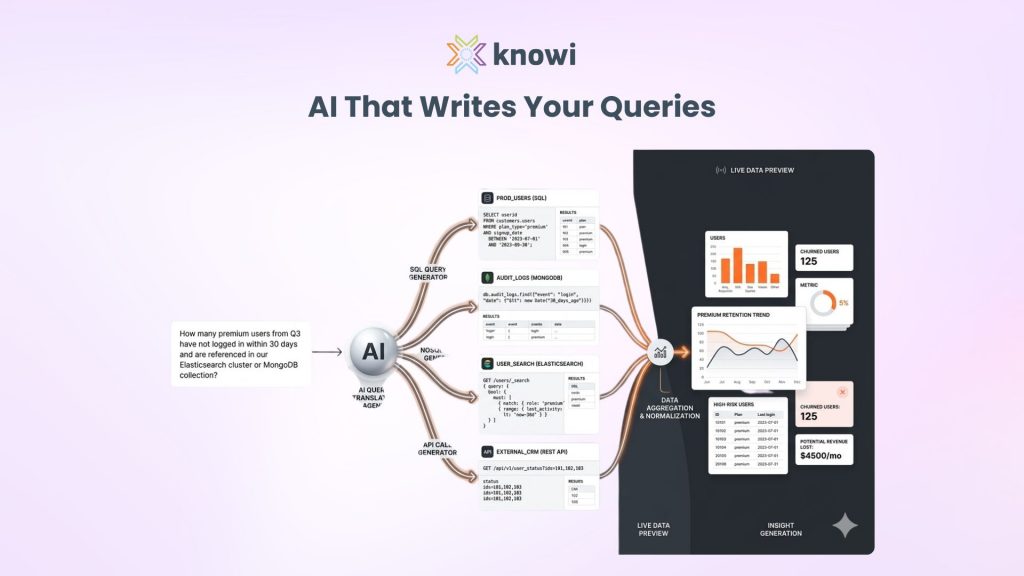
What Is a Query Agent? AI-Powered Data Querying Across SQL, NoSQL and API in 2026
Query agents use AI to write and execute queries across SQL, NoSQL, and API sources. Learn how Knowi’s Query Agent eliminates the need for SQL skills.
Query agents use AI to write and execute queries across SQL, NoSQL, and API sources. Learn how Knowi’s Query Agent eliminates the need for SQL skills.
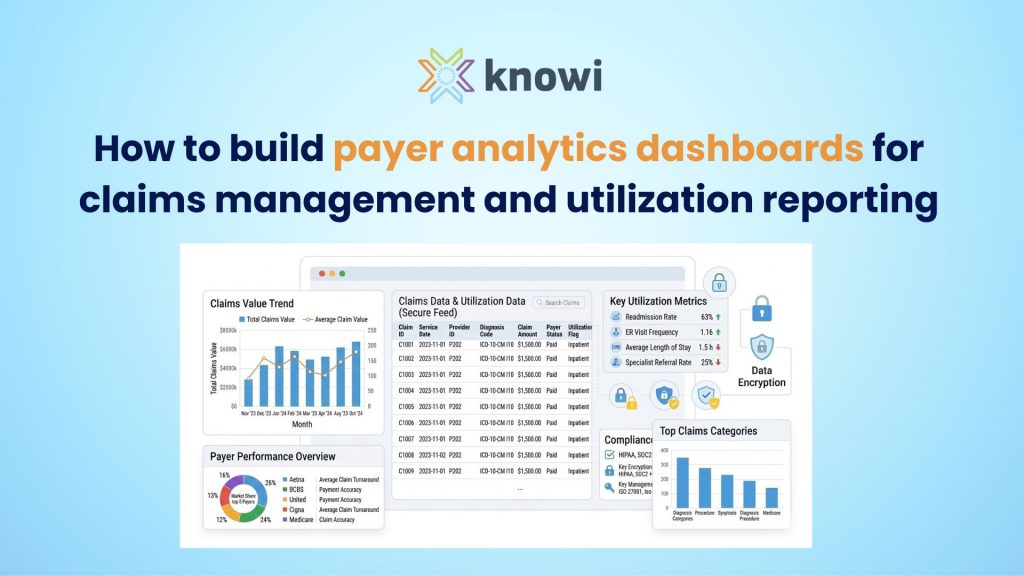
Learn how to build payer analytics dashboards for claims management and utilization reporting. Compare BI architectures, KPIs and embedded analytics options.

Learn how to use FHIR R4 and HL7 v2 feeds for healthcare analytics without copying PHI. Covers authentication, scope control and query-in-place architecture.
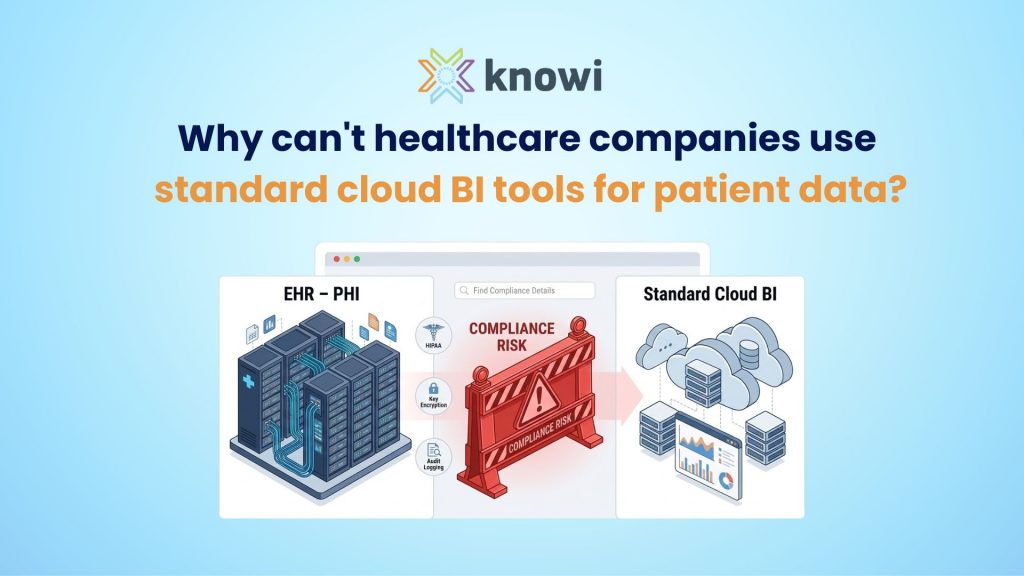
Why healthcare BI tools must handle HIPAA data differently. Learn the risks of standard cloud BI and safer analytics architectures.
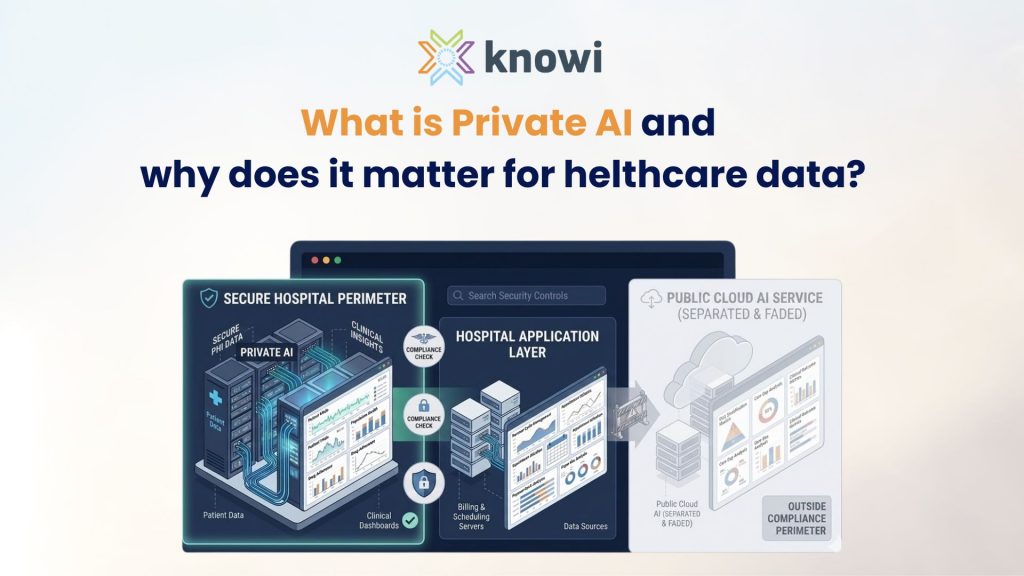
Learn why private AI healthcare deployments protect PHI, reduce vendor risk, and support secure analytics. Book a demo.
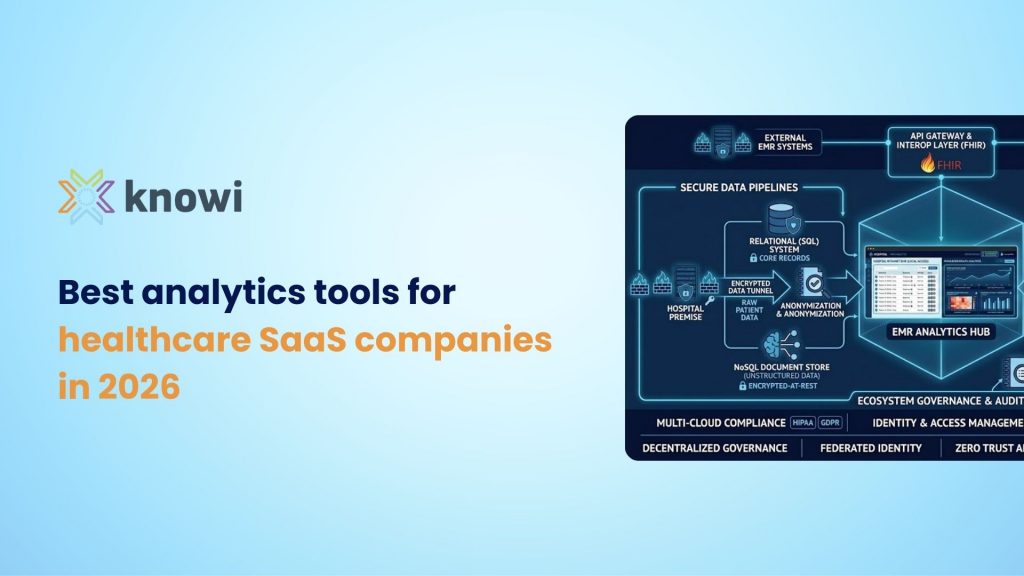
Compare the best healthcare SaaS analytics tools in 2026. Learn how embedded analytics platforms support HIPAA security and multi-tenant dashboards
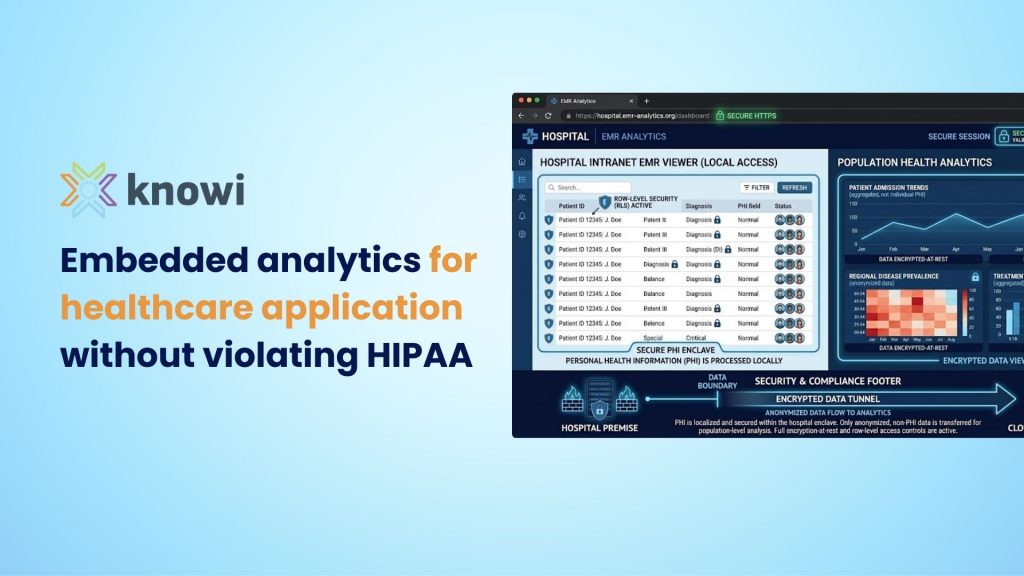
Learn how to embed analytics in healthcare without violating HIPAA. Compare secure methods, BAAs, and deployment options. Book a demo.
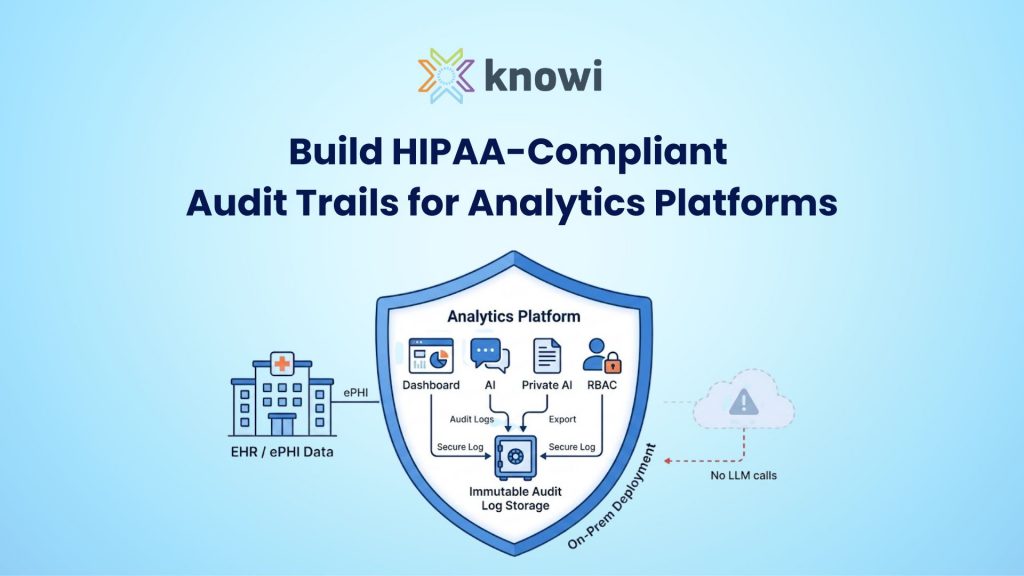
To build HIPAA-compliant audit trails for analytics platforms, you must log and examine every access event involving ePHI, including queries, dashboard views, exports, and AI interactions. You also need role-based access control, row-level security, immutable log retention, and documented review workflows. Quick Summary (TL;DR) HIPAA 45 CFR 164.312(b) requires organizations to both record and examine …
How Do You Build HIPAA-Compliant Audit Trails for Analytics Platforms? Read More »
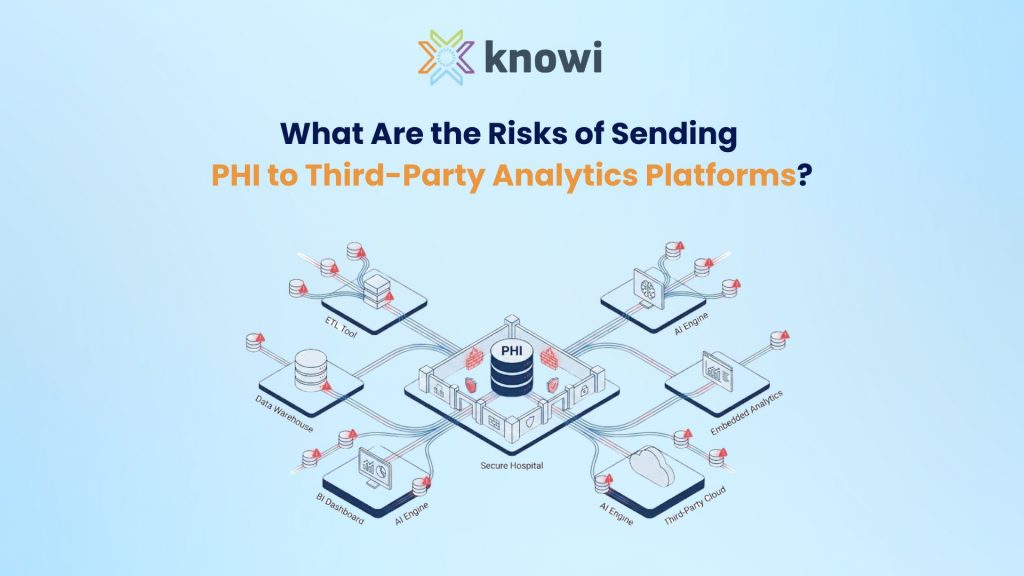
Sending PHI to third-party analytics platforms increases breach exposure, HIPAA compliance risk, and loss of control over data access, retention, and subprocessor chains. Key risks include weak BAAs, data duplication through extracts, tracking technology disclosures, incomplete audit logging, and AI-related data transmission. Quick Summary (TL;DR) A Business Associate Agreement is required before any third party …
What Are the Risks of Sending PHI to Third-Party Analytics Platforms? Read More »
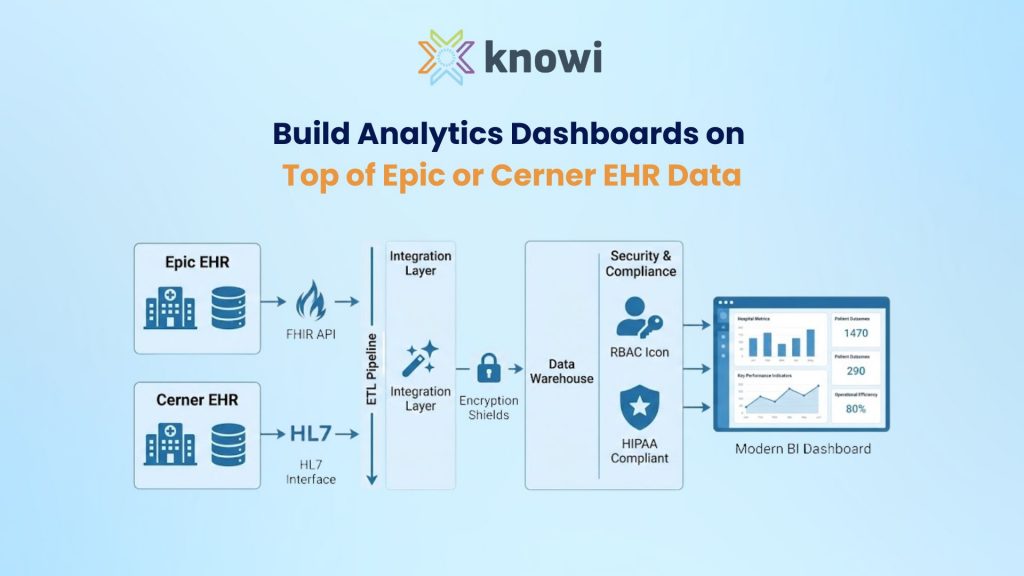
To build analytics dashboards on Epic or Cerner EHR data, connect to reporting layers such as Epic Clarity, Caboodle, or Cerner ODS instead of the live transactional database. Use FHIR APIs for standards-based access where appropriate. Enforce HIPAA controls through on-prem deployment, row-level security, audit logging, and minimum-necessary dataset design. Quick Summary (TL;DR) Never query …
How to Build Analytics Dashboards on Top of Epic or Cerner EHR Data Read More »