
Maybe you’re an Oakland resident curious about the type and/or frequency of crime in your neighborhood, or maybe you work in Oakland and you’re looking to park in areas with the least number of vehicle break-ins.
Regardless of the question you’d like to ask regarding Oakland’s CrimeWatch Data, you can seamlessly connect to this dataset using Knowi’s REST API connection tool and visualize your answer using one of our 30+ custom widgets. Knowi also allows you to run direct queries (for real-time data) so that your dashboard is always up-to-date.
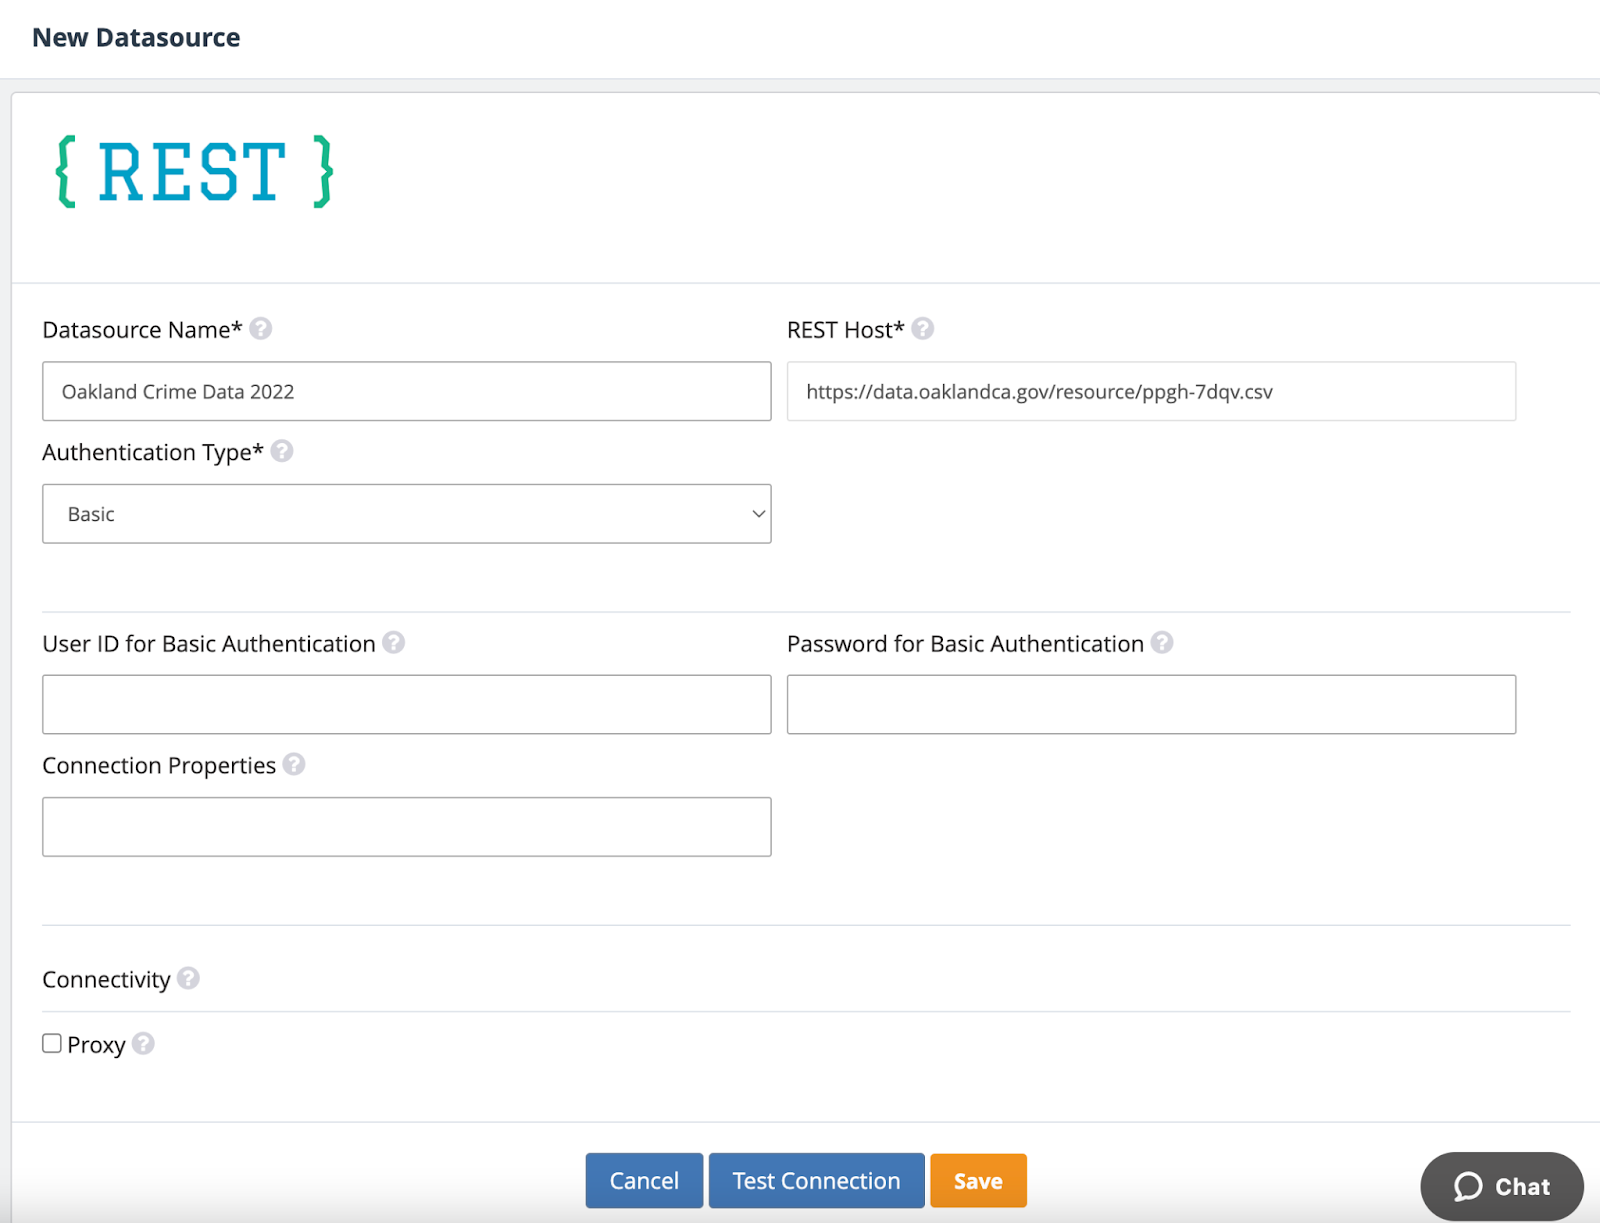
1. Connect to Oakland’s CrimeWatch Data Using Knowi’s REST API Tool
Follow the Guide on Connecting to a REST API
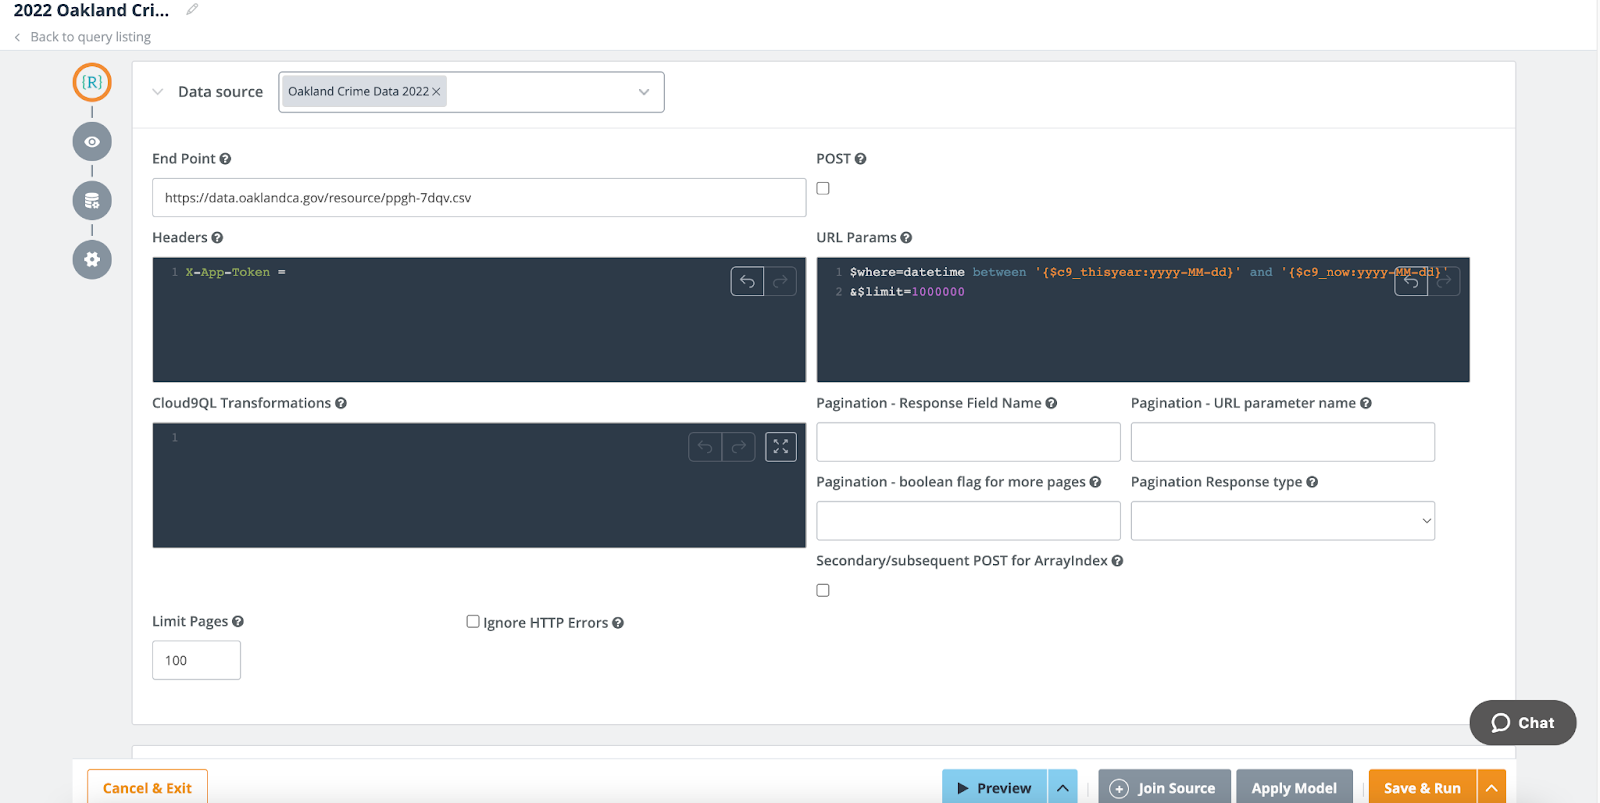
2. Create a Dataset
Read about the dataset basics here.
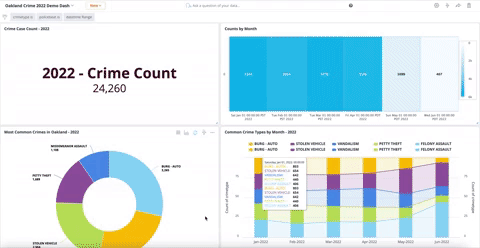
3. Create Visualizations, Answer Questions
Here is a short guide on how to create a widget.
You can select, group, sort, and filter by dragging and dropping fields. Alternatively, you can use the search bar at the top to ask a question.
Try entering: “show me total crime by crimetype sort descending”
What burning questions do you have about Oakland Crime? See if you can answer and visualize it using Knowi.
See a live Knowi dashboard created using Oakland’s CrimeWatch data
*Note: If you’re interested in filtering the data by a particular police area, you can search up a police district (beat) by address here: http://gisapps1.mapoakland.com/policedistricts/
Tell us what you think about the dashboard here!