When comparing Grafana, Kibana, and Knowi, the key difference lies in scope. Grafana focuses on visualization, Kibana is tightly coupled with Elasticsearch, while Knowi provides a full analytics platform with multi-source integration, search-based querying, alerts, and built-in machine learning. The best choice depends on whether you need simple dashboards or end-to-end analytics across systems.
TL;DR
- Grafana is best for flexible and visually rich dashboards
- Kibana is ideal for pure Elasticsearch use cases within the ELK stack
- Knowi supports 36+ data sources and REST APIs for cross-source analytics
- Only Knowi combines visualization, querying, alerts, and machine learning in one platform
- Kibana lacks alerts and user management out of the box
- Grafana does not support log querying, which limits debugging use cases
- Choose based on whether you need visualization only or full analytics
Table of Contents
Before we kick off this comparison, here are a couple of quick resources. If you have a project and are trying to visualize your Elasticsearch data, take a look at our Elasticsearch Analytics page where you can start a Knowi trial. You can also set up a 15-minute call with a member of our team to see if Knowi may be a good BI solution for your project.
Intro: Grafana vs Kibana vs Knowi
In today’s digital world when a person uses the term “Big Data”, the first thing which comes to mind is the sea of data that humans, social networks, and IoT devices are generating. But we often miss the big data deluge that is getting generated by servers, cloud infrastructure applications, and web-based business tools across the globe. Daily, these systems are generating tons of data in their logs. These log datasets are crucial to properly monitor these systems. But a person cannot monitor and analyze such huge amounts of log data in raw format manually. This is where data visualization tools can be a big help. Log data visualization dashboards can be useful for monitoring server and application logs to make an IT team more efficient.
Grafana, Kibana. and Knowi are some of the best visualization tools available in the market. In this article, we shall give you a comparison of Grafana vs Kibana vs Knowi so that you can make the correct choice for your log management needs. Let us first understand each of them in more detail.
Grafana
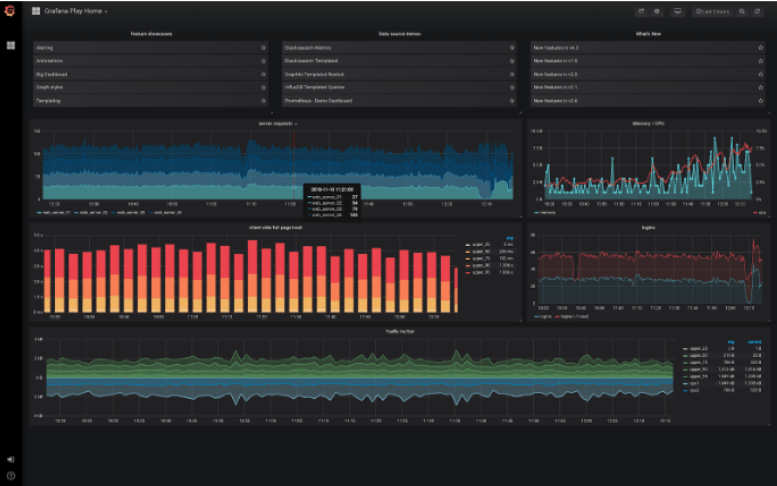
Grafana is an open-source tool that can be used to visualize any data. It can be used to create multiple dashboards that support a variety of beautiful graphs and visualizations for different users and stakeholders.
It has support for integration with a few different data sources, including Graphite, InfluxDB, and Elasticsearch.

Kibana
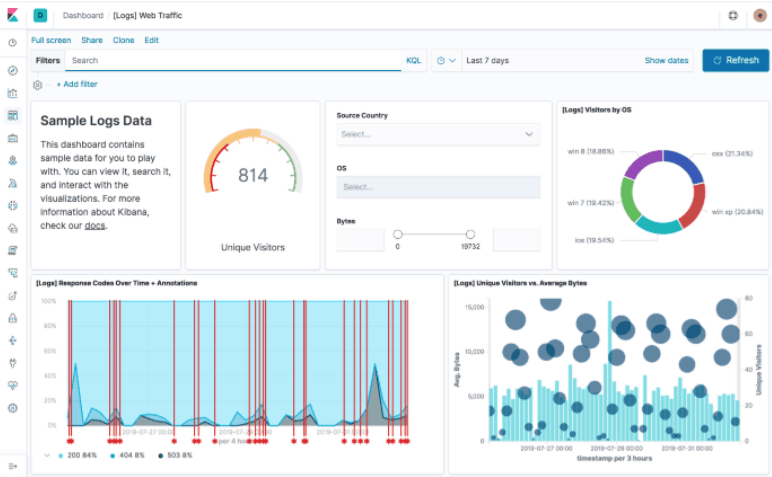
Kibana is the visualization tool of the very popular ELK stack. ELK stack is a collection of 3 open-sourced tools: Elasticsearch, Logstash, and Kibana. The ELK stack is used for end-to-end log management and monitoring solutions for Elasticsearch data.
Kibana, which is the ‘K’ of ELK stack, is used for visualizing and analyzing the log data in Elasticsearch. Kibana does not support integration with any other data source and works only with Elasticsearch.

Knowi
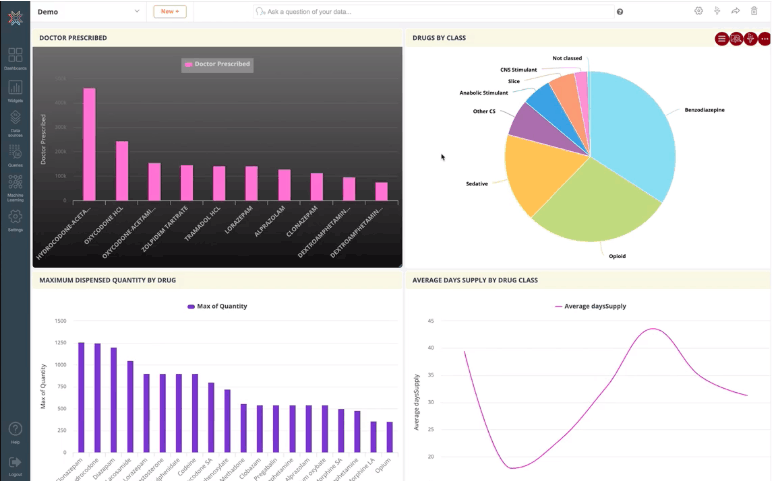
Knowi is a modern business intelligence platform that has a host of features for both data engineers and data scientists. It has native integrations to plenty of SQL and NoSQL based data sources. Knowi provides rich visualizations for advanced analytics, on-demand reporting, and user dashboards.
Keeping with the current disruption of artificial intelligence, Knowi also offers integration of machine learning and natural language processing. The ML feature helps users to build machine learning-based triggers in the workflow. While the search-based analytics feature (also called natural language business intelligence) allows non-technical users the ability to query the data just like they would ask questions in a google search.

Grafana vs Kibana vs Knowi
Let us now do an in-depth comparison between these three tools on various parameters and understand which of the three will suit your requirements.
Visualization
Both Grafana and Kibana are essentially visualization tools and they offer a plethora of features to create graphs and dashboards. But Grafana is more popular for producing beautiful and visually appealing graphs and dashboards.
Moreover, Grafana is known to be more customizable and flexible when compared to Kibana. But at the same time, Kibana is easier to set up.
On the other hand, as a BI platform, Knowi also offers rich visualization. As a matter of fact, Knowi provides over 30+ visualizations while Kibana only supports 17.
In spite of these differences, Grafana, Kibana, and Knowi are neck-to-neck in their visualization features. If you are not looking for something specific, then visualization should be least of your worries in deciding between Grafana, Kibana, and Kibana. A more important point to think about might be data source integration.
Integration with Data Sources
Grafana officially supports integration with 14 data sources like MySQL, Graphite, InfluxDB, PostgreSQL, and Prometheus to name a few. Knowi, on the other hand, supports a wider range of 36 different data sources which include, Oracle, MySQL, MongoDB, PostgreSQL, Apache Cassandra, Elasticsearch, etc. And those are just the listed native integrations. With its ability to connect to any REST API, the total number of possible data sources is limitless.
The ability to tap data from multiple data sources makes both Grafana and Knowi truly versatile options for any sort of log management architecture.
Kibana, however, only supports integration with Elasticsearch. It might look like a big shortcoming of Kibana, but on the positive side, if your project uses only Elasticsearch (and you do not think it will expand in the future to include more data sources) then you should consider Kibana as it is coupled tightly in the ELK stack.
Grafana and Knowi, however, do still fully support Elasticsearch integration and can be considered over Kibana if they bring more on the table for your particular use-case.
Log Search and Analysis
While doing some analysis or debugging you may need to search through the logs. Both Knowi and Kibana support querying on text data. Hence log analysis can be performed with these two tools. However, this support is not currently present in Grafana and is seen as a major drawback of choosing that platform.
One use-case where this querying feature may be a good reason for you to choose either Knowi or Kibana over Grafana, is if you intend to build a monitoring solution for a technical support team that analyzes issues from logs. In such a use-case text-data querying would be essential.
Proactive Alerts
A crucial aspect of monitoring sensitive systems is to detect certain issues proactively so that action can be taken in advance before it leads to severe consequences. For example, we can set a rule to send alerts when a server memory utilization crosses 90%. This will help the operations team to bring down the memory utilization and hence avoid any unwanted outage on the system.
Both Grafana and Knowi have built-in features for raising alerts against a set of rules that can be defined by us. Kibana, however, does not offer support for Alerts out of the box. It instead requires 3rd party integration to enable Alerts.
User Authorization
In a big enterprise where there are many users and stakeholders, you would not like all users to access the data. This holds true even for monitoring dashboards. You would like certain users to access only certain dashboards. Or maybe your requirement is to create a dashboard specific to certain users.
The good thing is that both Grafana and Knowi provide user management features out of the box. You can create users and roles, and authorize specific dashboard access to them.
Kibana does not offer any user management features. This means whoever has the link to the Kibana dashboard can see the data. This might not always be a good way of working. But the saving grace is that we can still implement user and role restrictions in Kibana with the help of 3rd party integrations.
Online Community
Both Grafana and Kibana are open source and are under active development on GitHub. This means there is good online community support available for both if needed. If the popularity of both projects has to be measured, then it is worth noting that on Github, Kibana has more commits than Grafana.
Knowi, however, is not an open-source tool currently. Still, they do have their own forum on their website where you can seek help from other users. But what they lack in community may be made up for in customer support. As a relatively young startup looking to make a name for themselves, they have a dynamic, responsive, and strongly motivated team of solution engineers looking to prove that their product is the best on the market.
Machine Learning
Currently, machine learning is making inroads in all possible spaces globally where there is data. If you have loads of big data you would not like to miss the opportunity to apply machine learning to get hidden insights and patterns from data. Imagine, if you can predict any potential risk from logs data well in advance and take precautionary measures. This can take the log monitoring process to a whole new level.
Grafana does not currently support machine learning although the ELK stack does support some machine learning capabilities. Knowi has built-in integration with many machine learning algorithms like Classification, Regression, and Time-Series Anomaly Detection type Machine Learning use cases, with clustering and deep learning coming soon.
This enables Knowi users to do predictive analysis using machine learning and set up a triggering alert based on the prediction in the monitoring workflow.
Purpose
Till now, we have done a comparison of Grafana vs Kibana vs Knowi with respect to the features they offer. But we need to understand one thing that the underlying purpose of using the tools is slightly different.
Kibana is useful to convert log data from the ELK stack into visualizations and it also supports querying logs.
Grafana is more of a general-purpose visualization tool that can work with a handful of data sets that may or may not be “logs”. But it does not support text querying.
Knowi is an end-to-end data analytics platform that can sit on top of and across multiple databases, structured or unstructured. Knowi literally supports all the features and integrations that either Kibana or Grafana offers plus much more. And it does have a big edge due to it’s out of the box machine learning solution. That said, both Kibana and Grafana can be deployed for free or at a very low cost, while Knowi is an enterprise solution that does have licensing fees. But with those added expenses come a lot of support, which can be nice when getting a complex data analytics solution off the ground.
Grafana vs Kibana vs Knowi: Key Differences
| Grafana | Kibana | Knowi | |
|---|---|---|---|
| Visualization | Offers visually appealing graphs and dashboards | Offers graphs and dashboards | Offers rich visualization with 30+ visualizations |
| Integration with Data Sources | Supports 14 data sources | Supports only Elasticsearch | Supports 36+ data sources, including native integrations and REST API connections |
| Log Search and Analysis | Does not support log querying | Supports log querying | Supports log querying |
| Proactive Alerts | Supports alerts out of the box | Does not support alerts out of the box | Supports alerts out of the box |
| User Authorization | Provides user management features | Does not provide user management features | Provides user management features |
| Online Community | Active online community support | Active online community support | Limited community support, strong customer support |
| Machine Learning | Does not support machine learning | Does not support machine learning | Built-in integration with machine learning algorithms |
| Purpose | General-purpose visualization tool | Focused on converting log data into visualizations and querying logs | End-to-end data analytics platform, supports various databases and has machine learning capabilities |
Conclusion
People who work in the operation support team will tell you how important it is to monitor the health of applications, servers, and infrastructure. They continuously need to monitor these systems since an outage can result in a huge loss to the business.
Grafana or Kibana or Knowi can be a good choice for your monitoring solution. As we saw, they have their own pros and cons, and differences in features. What will work best for you depends on your use case and you should evaluate your project needs before making the choice between the three platforms.
Last updated on April 13th, 2022