Best Analytics Tools for OpenSearch (2025)
Explore the top analytics tools for OpenSearch—including Knowi—for AI insights, multi-source joins, and advanced dashboards beyond log data.
Explore the top analytics tools for OpenSearch—including Knowi—for AI insights, multi-source joins, and advanced dashboards beyond log data.
Discover 5 key challenges facing modern data engineers today and practical solutions to build a resilient, efficient, AI-ready data stack.
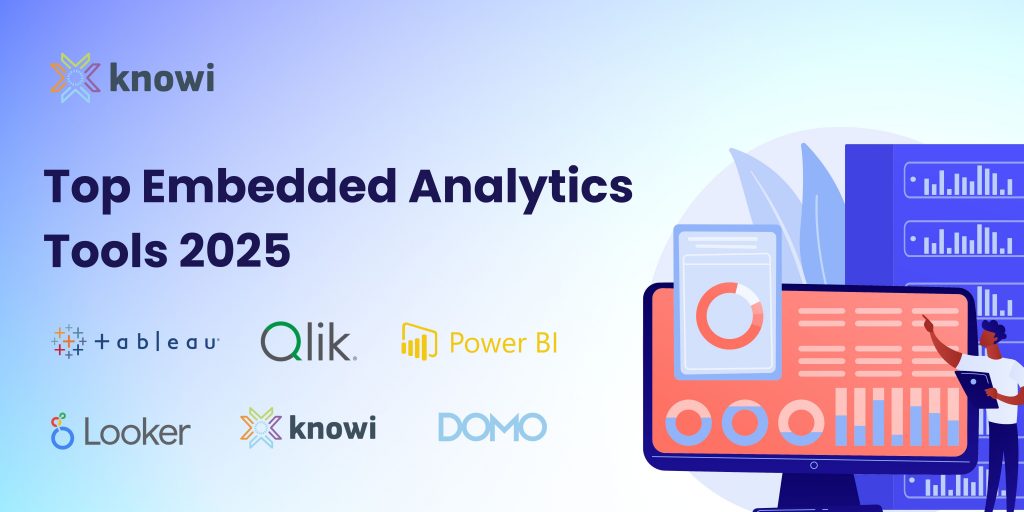
Embedded Analytics is a must-have. Explore top embedded analytics tools (2025), Tableau, Knowi, Power BI, Domo, Qlik, Looker and their latest features.
Embedded analytics: Buy or build? Learn why in-house sounds easy but hides costs, and see how Knowi delivers fast, scalable, AI-powered analytics.

Check out the newly launched Knowi AI Conversational interface along with core Knowi enhancements to make analytics easier, more efficient and more insightful than ever before!

Domo is user-friendly and feature-rich, but costly and limited with NoSQL and AI. Explore when to switch and why Knowi might be the better fit.
OpenSearch isn’t built for BI, but Knowi bridges the gap with native integration, real-time dashboards, cross-source joins, and AI-powered insights.
Struggling to analyze Amazon DocumentDB data? Learn why traditional BI tools fall short—and how Knowi delivers real-time, no-ETL analytics that actually work.
Amazon DocumentDB explained: discover what it is and compare top analytics tools—Tableau, Power BI, QuickSight, Knowi—to find the right fit.
In this blog, we show how to create visualizations from the dataset, blend data between Couchbase and SQL database, and use search-based analytics.