Stay ahead with expert insights, trends, and practical guides on AI analytics, data strategy, and the evolution of business intelligence.
Insights. Intelligence. Impact.
Trends, perspectives, and product deep dives in AI and data analytics— by the Knowi team.
Make Data Work for You: 5 Must-Have Features in your Data Analytics Platform
You must have these 5 features in your data analytics platform if you want to make your data work harder but smarter and give you the insights that matter most!
Data Engineering Trends You can’t Ignore
Read on to know about the next wave of data engineering tools and techniques that are reshaping the industry standards and driving innovation.

Understanding the REST API Concepts
This blog post highlights practical REST API concepts like pagination, rate limiting, filtering, data formats, and error handling.
Using Gen AI to Power Data Analytics
Gen AI revolutionizes data analytics by automating data interpretation, and generating insights, allowing organizations to fully leverage their data.
Understanding Data Mesh, principles and implementation
Learn about Data Mesh, a strategic framework that is reshaping how businesses approach data architecture, management, and analytics.

REST API Authentication Guide 2025: 4 Methods Compared (OAuth, JWT, API Keys)
Secure your REST API: compare OAuth 2.0, JWT tokens, API keys, and Basic Auth. Code examples + security best practices for 2025.
Data Fabric: Introduction, features and benefits
Learn about Data Fabric, a data management methodology that helps you with unified access to all your data, simplifies management and unlocks insights.
Elasticsearch vs. MySQL: What to Choose?
TL;DR Elasticsearch Open-source distributed search & analytics engine. Excels at real-time search, log/event data, and full-text search. Highly scalable with JSON-based document model. Best for
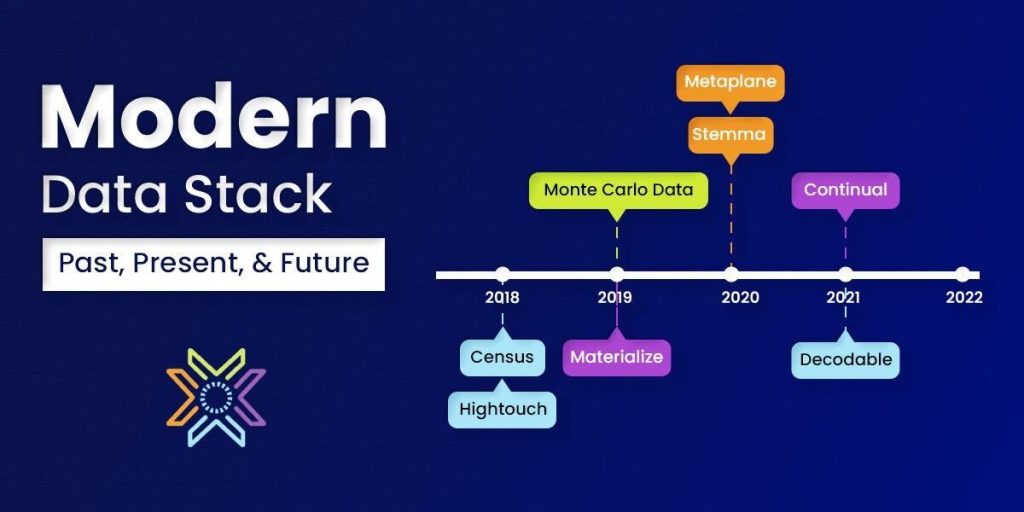
Modern Data Stack: Past, Present, & Future!
A group of technologies that comprise a data pipeline is referred to as the modern data stack. It enables businesses to gather data from multiple data sources, push it into a data warehouse, and connect the data warehouse to a business intelligence tool for tasks like data visualization to speed up decision-making.
Unify. Analyze. Act.
Experience AI Data Analytics across any data source with Knowi