
For data teams working with MongoDB, the primary options for analytics are MongoDB Charts and Knowi. MongoDB Charts excels at native, single-collection visualization within the Atlas ecosystem, while Knowi is built for complex, multi-source data federation and advanced AI-driven analytics without requiring ETL.
TL;DR: Knowi vs MongoDB Charts
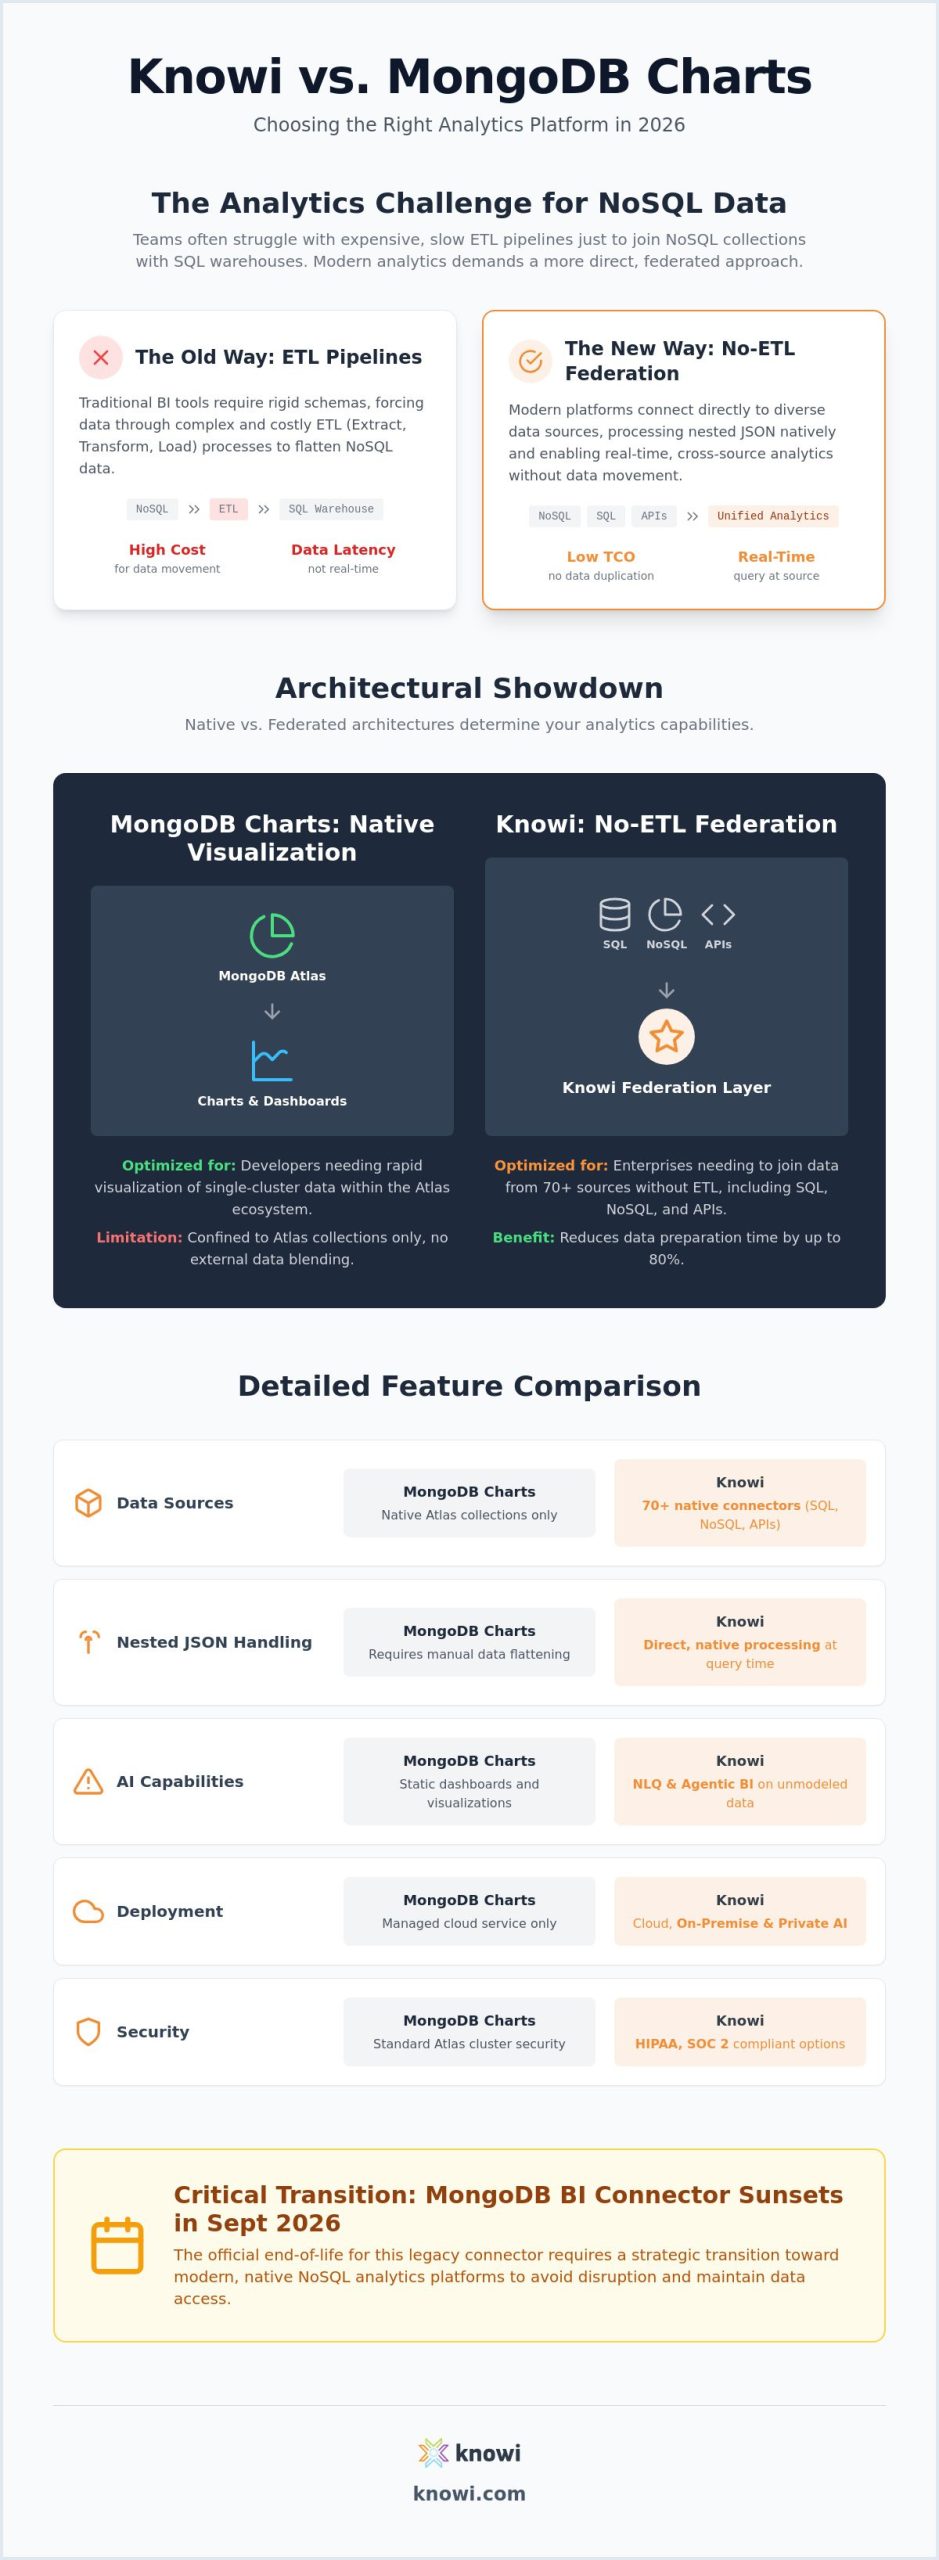
- Architecture: MongoDB Charts is a native feature of Atlas, optimized for visualizing data within a single MongoDB cluster. Knowi uses a No-ETL data federation architecture to query and join data live across more than 70 sources, including MongoDB, SQL databases, and APIs.
- Data Handling: Charts works directly with MongoDB collections but struggles with joining external data sources. The alternative platform natively processes nested JSON and arrays without pre-processing or flattening, enabling direct queries on raw NoSQL structures.
- Cross-Source Joins: Joining MongoDB data with a SQL warehouse like Snowflake is not a core function of MongoDB Charts. This requires a separate data pipeline. Knowi performs cross-source joins virtually, querying data where it lives to unify insights without data movement.
- AI & Automation: MongoDB Charts offers basic dashboarding and visualization features. Knowi provides integrated Natural Language Querying (NLQ) on unmodeled data and Agentic BI capabilities for automating data workflows and generating insights autonomously.
- Deployment: Charts is a cloud-only service integrated into MongoDB Atlas. The alternative solution offers flexible deployment models, including multi-tenant cloud, on-premises, and private cloud for organizations with strict data residency or compliance requirements.
- Use Case: MongoDB Charts is ideal for developers and analysts needing quick, simple visualizations of data from a single Atlas cluster. Knowi is designed for enterprises that need to unify analytics across a distributed data ecosystem, embed analytics into applications, or leverage AI on complex, multi-structured data.
Knowi vs MongoDB Charts: Choosing the Right Analytics Platform in 2026
MongoDB’s flexible document model has become a cornerstone of modern application development, but visualizing its semi-structured data presents unique challenges. Traditional BI tools, built for the rigid rows and columns of SQL, often require costly and brittle ETL pipelines to flatten MongoDB’s nested JSON into a relational format. This process introduces latency, increases data engineering overhead, and strips the native data of its rich, hierarchical context.
As the data landscape evolves, two distinct approaches have emerged to address this challenge. The first is the native, integrated tool represented by MongoDB Charts. The second is the federated, AI-driven platform designed for a multi-source world. This comparison provides a technical deep-dive to help data engineers and architects determine which platform aligns with their organization’s long-term data strategy.
The Evolution of MongoDB Data Visualization
In the early days, connecting a BI tool to MongoDB required the BI Connector, which translated the document model into a relational schema. This allowed tools like Tableau to query MongoDB using SQL. However, this translation layer introduced performance bottlenecks and often failed to represent complex nested arrays and objects accurately.
That translation layer is now being retired: MongoDB’s Connector for BI reaches end-of-life after September 2026 for both Atlas and on-premises deployments. Teams still routing Tableau or Power BI through it have a migration to plan, and the replacement paths are covered in MongoDB BI Connector alternatives.
The introduction of MongoDB Charts provided a native solution, eliminating the need for the BI Connector by working directly with MongoDB collections. To learn more about its core functionality, see this detailed guide on what MongoDB Charts is and how it works. While a significant improvement for Atlas-only use cases, it did not solve the broader enterprise challenge of unifying MongoDB data with other critical data sources like SQL warehouses or REST APIs.
This gap led to the emergence of the No-ETL paradigm, where analytics platforms connect directly to disparate sources. These systems query data in its native format and location, eliminating the need for centralized data warehouses and complex transformation pipelines for analytics purposes. This approach preserves the integrity of raw, unstructured data and enables real-time insights across the entire data ecosystem.
Defining the Core Competitors
MongoDB Charts is a data visualization tool built into the MongoDB Atlas cloud platform. Its primary strength is its seamless integration with Atlas, allowing developers to create dashboards and charts from their MongoDB collections quickly. It is designed for ease of use and is often the default choice for teams whose data resides exclusively within the MongoDB ecosystem.
Knowi is an enterprise analytics platform architected for data federation and AI-driven insights. It connects natively to MongoDB and dozens of other SQL, NoSQL, API, and file-based sources. Its core differentiator is its ability to perform cross-source joins without ETL, query nested JSON directly, and enable non-technical users to ask questions in plain English via its integrated NLQ and Agentic BI capabilities.
The choice between them often comes down to architectural needs. A project team monitoring a single application in Atlas may find MongoDB Charts sufficient. An enterprise architect tasked with creating a unified analytics layer across MongoDB, Snowflake, and Postgres will require a platform built for federation and complexity.
Data Integration Architectures: Native Connectivity vs. No-ETL Federation
The fundamental difference between MongoDB Charts and a federated analytics platform lies in their data integration architecture. Charts operates on a model of static, single-source access within the Atlas environment. A federated platform operates on a dynamic, multi-source model that queries data live from wherever it resides.
MongoDB’s document model, which allows for nested objects and arrays within a single document, is powerful for application development but challenging for analytics. Flattening this data into a tabular format for traditional BI tools can result in data loss or overly complex, wide tables that are difficult to query. A No-ETL approach bypasses this problem entirely by processing the JSON structure natively.
This architectural distinction has significant implications for data engineering workload, query performance, and the ability to generate comprehensive insights. Instead of moving and transforming data into a centralized repository, a federated system uses a smart query execution layer that pushes down processing to the source systems where possible and handles joins virtually. This schema-on-read approach provides greater flexibility and reduces the time to insight.
Handling Nested JSON and Unstructured Data
MongoDB Charts can render visualizations from fields within nested documents and arrays. However, its capabilities are generally confined to data within a single collection. Complex analytics that require un-nesting and joining arrays across different documents or collections can become challenging.
A native NoSQL analytics platform is designed to handle these structures without pre-processing. It can directly execute queries that traverse nested JSON, such as calculating the average of a value buried deep within an array of objects across millions of documents. For example, a query like `select c.user.address.state, sum(c.order.line_item.price)` can be executed directly on raw MongoDB data without any prior schema definition or data flattening.
This native processing is critical for performance on unmodeled datasets. By avoiding the overhead of SQL-to-NoSQL translation or ETL, queries on complex, semi-structured data can execute significantly faster. This enables interactive exploration of raw data, a task that is often impractical with traditional BI architectures.
Cross-Source Analytics without Data Movement
A common enterprise requirement is to join operational data from a MongoDB application database with business data from a SQL data warehouse like Snowflake or a relational database like Postgres. With MongoDB Charts, this is not possible within the tool itself. An external ETL process must be built to move data from the SQL source into MongoDB or vice-versa, creating a secondary, blended dataset for analytics.
No-ETL federation solves this by creating a unified semantic layer over disparate data sources. The platform understands how to query MongoDB via MQL and Snowflake via SQL, allowing users to define joins between them as if they were tables in a single database. For a technical overview of this process, see this guide on how to join data from SQL and NoSQL databases.
This approach dramatically reduces data engineering overhead. It eliminates the need to build, manage, and monitor data pipelines solely for analytics. It also ensures that insights are based on the most current data, as queries are run against the live source systems rather than a stale copy in a data warehouse.
This real-time visibility is a game-changer for complex operational workflows like supply chain management. For instance, you can learn more about Packaging For Industry (PFI) and how they implement vendor-managed inventory to optimize efficiency and reduce overhead.
Feature Comparison: Evaluating MongoDB Charts and Knowi
Beyond architecture, a direct feature comparison reveals the different target audiences and use cases for each platform. MongoDB Charts focuses on core visualization and dashboarding capabilities for a specific data source. A comprehensive analytics platform provides a broader suite of tools for enterprise-wide data access, governance, and insight generation.
Key areas of differentiation include multi-tenancy for SaaS providers, advanced security frameworks like granular role-based access control (RBAC), and deployment flexibility. While Charts is a capable tool for its intended purpose, enterprises often encounter limitations as their data ecosystem and security requirements grow in complexity.
The following table provides a structured comparison of key features, moving beyond simple checkmarks to describe the functional differences between the two platforms.
▎ See it on your own data. Knowi queries MongoDB natively, no flattening, no ETL, with agentic AI on top. Request a demo →
Feature Matrix: MongoDB Charts vs Knowi
| Feature | MongoDB Charts | Knowi |
|---|---|---|
| Data Sources | Natively connects to MongoDB Atlas clusters. Connectivity to other sources requires moving data into Atlas. | Natively connects to 70+ sources including MongoDB, SQL databases (Snowflake, Postgres), NoSQL databases (Elasticsearch), REST APIs, and file storage. |
| Data Joins | Supports lookups and joins between collections within the same MongoDB database. Does not support joins with external SQL databases. | Performs cross-source joins virtually across any connected data source without requiring ETL or data movement. Can join MongoDB collections with SQL tables directly. |
| AI Capabilities | Provides standard dashboarding and visualization features. AI capabilities are limited to basic chart suggestions. | Features integrated Natural Language Querying (NLQ) on raw data, and Agentic BI for autonomous insight discovery and workflow automation. |
| Deployment Options | Cloud-only, fully managed service integrated within MongoDB Atlas. No on-premises or private cloud option. | Flexible deployment models including a multi-tenant SaaS cloud, on-premises installation, or deployment within a customer’s private cloud (VPC). |
| Security & Compliance | Relies on MongoDB Atlas security features, including database-level roles and IP access lists. | Offers granular RBAC, data masking, and row-level security. Supports HIPAA and SOC 2 compliant deployments for regulated industries. |
Embedded Analytics for SaaS Applications
For SaaS companies that need to provide analytics to their customers, embedded analytics is a critical capability. MongoDB Charts offers basic embedding through iframes, which allows a dashboard to be displayed within another application. While simple to implement, this approach offers limited customization and integration possibilities.
A more robust solution for embedded analytics for SaaS utilizes a full API-driven approach. This allows for deep integration, where analytics components can be seamlessly woven into the host application’s user interface. It also enables advanced features like multi-tenant data isolation, where each customer’s data is securely segregated at the query level, and white-labeling to match the look and feel of the parent application.
For a broader look at how different tools handle this, the MongoDB Charts vs Metabase vs Knowi comparison provides additional context on embedded use cases. The ability to manage thousands of tenants with unique data access rules and custom styling is a key differentiator for enterprise-grade embedded platforms.
AI-Driven Analytics: From Static Dashboards to Agentic BI
The field of business intelligence is undergoing a fundamental shift from descriptive analytics (what happened) to autonomous, agentic workflows (what should we do about it, and why). Static, pre-built dashboards are being augmented by systems that allow users to ask questions in natural language and receive instant, data-backed answers. This transition is particularly relevant for complex data sources like MongoDB, where building every possible query into a dashboard is impractical.
AI agents in analytics go beyond simple NLQ. They can be tasked with monitoring KPIs, detecting anomalies, and triggering actions in other systems based on data-driven insights. This requires a platform where the AI is not just a wrapper around a large language model (LLM), but is deeply integrated with the data query and federation engine.
Governed, enterprise data is the foundation for accurate AI. An effective AI analytics system must understand the metadata, relationships, and context of the underlying sources to generate trustworthy insights. This is where the integration of a federated data layer and an AI reasoning engine becomes a powerful combination.
NLQ on Unmodeled Data
One of the most significant challenges in self-service analytics is enabling non-technical users to query data themselves. With MongoDB, this is especially difficult due to its nested structure. Traditional NLQ systems often require a predefined semantic model or flattened data to function, reintroducing the ETL bottleneck.
Modern NLQ capabilities can operate directly on unmodeled, raw data. The system can parse a question like “Show me total sales by state for customers who bought product X last month,” translate it into a complex MQL query with the appropriate filters and aggregations, and return the answer as a visualization. It accomplishes this by dynamically understanding the JSON schema at query time.
This capability democratizes data access, allowing business users to get answers to ad-hoc questions without relying on data teams to build a new report. It transforms analytics from a static reporting function into an interactive, conversational experience, dramatically accelerating the speed of insight.
Private AI and Data Security
As organizations adopt generative AI, data security and privacy have become paramount concerns. Sending sensitive company or customer data to a third-party, public LLM for analysis is a non-starter for regulated industries like healthcare and finance. This has given rise to the concept of Private AI for analytics.
Private AI refers to an architecture where the entire analytics workflow, including any AI or LLM processing, occurs within the organization’s secure environment. This is typically achieved through an on-premises or private cloud deployment, ensuring that no sensitive data ever traverses the public internet or is processed by external services. For more details on this architecture, see this guide on Private AI deployment.
For organizations subject to regulations like HIPAA or SOC 2, this is not just a preference but a requirement. A platform that offers a HIPAA-compliant deployment model allows healthcare organizations to leverage advanced AI and NLQ on patient data without compromising security or data residency. This makes it possible to unlock insights from sensitive datasets while maintaining strict compliance.
Selection Framework: Where Knowi Fits Best
The choice between MongoDB Charts and a federated analytics platform is not about which tool is “better,” but which architecture is right for the job. An honest assessment of your organization’s data ecosystem, user needs, and future roadmap is essential.
MongoDB Charts is often the right choice for simple, Atlas-only visualization needs. It is tightly integrated, easy to use for developers, and included with the Atlas platform. However, there is a distinct “break point” where its limitations in data federation, enterprise security, and AI capabilities necessitate a more robust platform.
Migrating from a native tool to a federated platform can be a strategic decision to scale analytics capabilities across the enterprise. It represents a shift from single-source reporting to a unified data fabric that can answer complex business questions involving multiple systems. The goal is to create a single source of truth for analytics without creating another centralized data silo.
Knowi queries MongoDB natively, no ETL and no flattening into a warehouse first.
Nested documents and arrays stay as they are. AI agents connect to your cluster,
build the dashboards, answer questions in natural language, and deliver reports
on a schedule. Run it in the cloud or keep everything inside your
environment with Private AI.
Ideal Use Cases for MongoDB Charts
- Rapid Prototyping: Developers who need to quickly create a chart to monitor application performance or user activity within a single MongoDB collection.
- Simple Monitoring Dashboards: Operations teams building internal dashboards to track metrics from one or two collections in an Atlas cluster.
- Budget-Constrained Projects: Small teams or internal projects where the data is 100% within MongoDB Atlas and there is no budget for a dedicated, third-party analytics platform.
Ideal Use Cases for Knowi
- Unified Enterprise Analytics: Organizations that need to join MongoDB data with SQL warehouses (Snowflake, BigQuery), relational databases (Postgres, MySQL), and other sources to create a holistic view of the business.
- Embedded Analytics for SaaS: Software companies that require a robust, multi-tenant, and white-label embedded analytics solution for their customers, especially when their backend uses MongoDB alongside other databases.
- AI and Self-Service at Scale: Companies wanting to empower business users to ask their own questions of complex, unmodeled NoSQL data using Natural Language Queries.
- High-Compliance Industries: Organizations in healthcare, finance, or government that require on-premises or Private AI deployments to meet strict data security and residency standards like HIPAA.
Frequently Asked Questions
Does Knowi require a data warehouse to visualize MongoDB data?
No, it connects directly to MongoDB and other sources. Its No-ETL architecture eliminates the need for a separate data warehouse for analytics by querying data live from its native location.
Can MongoDB Charts join data from an external SQL database?
No, MongoDB Charts cannot directly join a MongoDB collection with a table from an external SQL database like Postgres or SQL Server. This would require a separate ETL process to move the data into MongoDB Atlas first.
Is Knowi HIPAA compliant for healthcare data analytics?
Yes, it can be deployed in a HIPAA-compliant manner. This is typically achieved through an on-premises or private cloud installation where all data and processing remain within the healthcare organization’s secure environment.
What is the difference between NLQ and standard SQL querying in BI?
Standard BI querying often requires users to drag and drop fields or write SQL code. NLQ (Natural Language Querying) allows users to ask questions in plain English, which the system then translates into a formal database query (like MQL or SQL) to retrieve the answer.
Can I deploy Knowi on-premises to keep data within my own network?
Yes, it offers an on-premises deployment option. This allows organizations to install and run the entire platform on their own infrastructure, ensuring that no data ever leaves their private network.
How does Knowi handle nested JSON arrays in MongoDB collections?
It processes nested JSON and arrays natively at query time. This means you can write queries that directly reference and perform calculations on fields deep within a complex document structure without needing to flatten the data into a tabular format first.