
The familiar dashboard choice may be the wrong fit for business analytics. In Knowi vs Grafana, the key question is whether your workload centers on operational observability or governed analysis across business data sources. The distinction affects how teams connect data, build analytics, and deploy the platform.
Grafana is designed for observability workflows, including monitoring time-series data from sources such as Prometheus. Knowi takes a federated analytics approach, querying SQL, NoSQL, and REST API sources directly, with cross-source joins that don’t require ETL or a separate data warehouse. That difference matters when teams need business insights alongside operational monitoring, without duplicating data to support analytics.
AI and deployment choices also shape the decision. Grafana 13.1, released in June 2026, expanded Grafana Assistant’s reach across data sources. Knowi’s Semantic Layer, introduced in August 2026, adds a business glossary and certified data assets to support more context-aware Agentic BI. This comparison examines each platform’s core purpose, data architecture, AI capabilities, embedding options, and deployment models so you can identify which one aligns with your analytics requirements.
Key Takeaways
- In Knowi vs Grafana, match the platform to the workload: observability or broader business analytics.
- Assess whether your analytics questions span SQL, NoSQL, API, and document sources before adding data pipelines.
- Compare AI capabilities by how each platform applies business context and governance to answers.
- Use your embedding and deployment requirements to narrow the options, including Private AI needs.
- Identify where Grafana’s observability strengths meet your needs and where cross-source analytics calls for a different approach.
Knowi vs Grafana: Start with the Workload, Not the Dashboard
Choose Grafana when the primary workload is infrastructure or application observability, including monitoring metrics and logs. Choose Knowi when teams need governed analytics across enterprise sources, embedded experiences, or NLQ. Their dashboards may look similar, but platform selection should follow the data architecture and decisions the team must support.
TL;DR
- Use Grafana for infrastructure and application observability workflows.
- Use Knowi for governed analytics across business data sources.
- Separate monitoring system behavior from answering broader business questions.
- Evaluate architecture and data needs, not dashboard appearance alone.
- Include embedded analytics and NLQ in the workload assessment.
- Consider complementary platform roles when teams need both observability and business analytics.
Observability helps teams understand system behavior through signals such as metrics and logs. The OpenTelemetry documentation describes these signals and their role in observing software systems. Analytics addresses broader questions, such as how product activity relates to customer or business data. Although both workloads can use dashboards, that interface overlap doesn’t make their architectures interchangeable.
What Grafana and Knowi are designed to do
Grafana supports observability workflows that bring data into dashboards for monitoring and investigation. Metrics are a common part of this work; the Prometheus documentation describes its time-series data model and monitoring use cases. Grafana can also visualize data from connected sources, so its use isn’t limited to one dashboard type.
Knowi is an agentic analytics platform that works with governed enterprise data. It supports business analysis across sources, including embedded analytics and NLQ. For SaaS teams evaluating customer-facing analytics, embedded analytics for SaaS applications shows how analytics can fit within a product experience.
Which workload points toward each platform?
Start with the decisions the team needs to support. Grafana is aligned with infrastructure and application monitoring, such as tracking service behavior through operational signals. Knowi fits when analysts or product teams need business analytics across sources, embedded experiences, or natural-language access to governed information.
- Use Grafana for operational visibility, such as monitoring services and investigating changes in metrics or logs.
- Use Knowi for cross-source business analysis, embedded analytics, and governed business context.
- Consider both when engineering teams need observability and business or product teams need analytics across enterprise data.
The practical decision is not which platform can display a chart. It’s whether the primary workload is understanding system behavior, answering business questions across data sources, or supporting both with platforms assigned to distinct roles.
Knowi vs Grafana Architecture: Time-Series Monitoring or Federated Analytics?
The architectural difference starts with the shape of the question. Observability commonly follows signals such as metrics and logs to understand system behavior over time. Business analytics often needs to relate data across systems, such as joining customer records in a database with product activity exposed through an API.
Monitoring-oriented pattern: Metrics and logs flow from operational sources into monitoring workflows, where teams inspect system behavior and identify changes.
Federated analytics pattern: Analytics queries connect to supported sources, then combine relevant data across them to answer business questions without first centralizing every dataset.
These patterns serve different purposes. Grafana supports data-source integrations for monitoring and visualization, and its workflows don’t all require ETL. Knowi’s architecture is designed for cross-source analytics, with direct connectivity to SQL, NoSQL, REST APIs, documents, and other supported sources without requiring a separate data warehouse.
How data movement and federation affect analytics
With federated analytics, Knowi can join data across connected sources without moving or duplicating the underlying data. For example, an analyst could relate account details in a SQL database to usage records in a NoSQL store, then analyze them together without first building a centralized copy for that query.
This differs from a warehouse-centered design, where data is consolidated in a central repository before analytics queries run against it. Federation can reduce the need to create additional copies for cross-source analysis, while a warehouse can remain useful when an organization deliberately wants centralized data preparation and storage.
The right architecture depends on source ownership, query patterns, governance, and operational requirements. Teams evaluating the trade-offs can compare federated analytics and data warehouses as distinct approaches, rather than assuming one replaces the other in every architecture.
Why nested JSON and semantic context matter
Operational and application data often arrives as nested JSON, with related attributes grouped inside a single object. Knowi supports native nested JSON analysis, helping teams work with useful source structure instead of requiring every field to be flattened before it can be analyzed. That matters when fields are nested several levels deep or represent relationships within an event or record.
Illustrative business question: Which customer accounts increased product usage after a support interaction, and how does that compare with their subscription tier?
Answering that question may require data from support, product usage, and subscription sources. Knowi’s semantic layer can define business terms consistently, giving AI agents governed context for interpreting concepts such as “active account” or “usage increase.” This connects NLQ to an organization’s terminology rather than leaving an agent to infer what those terms mean.
To evaluate how direct source access and cross-source analytics could apply to your architecture, explore a Knowi demo focused on your data sources and analytics requirements.
Knowi vs Grafana Feature Comparison: AI, Analytics, and Embedded Use
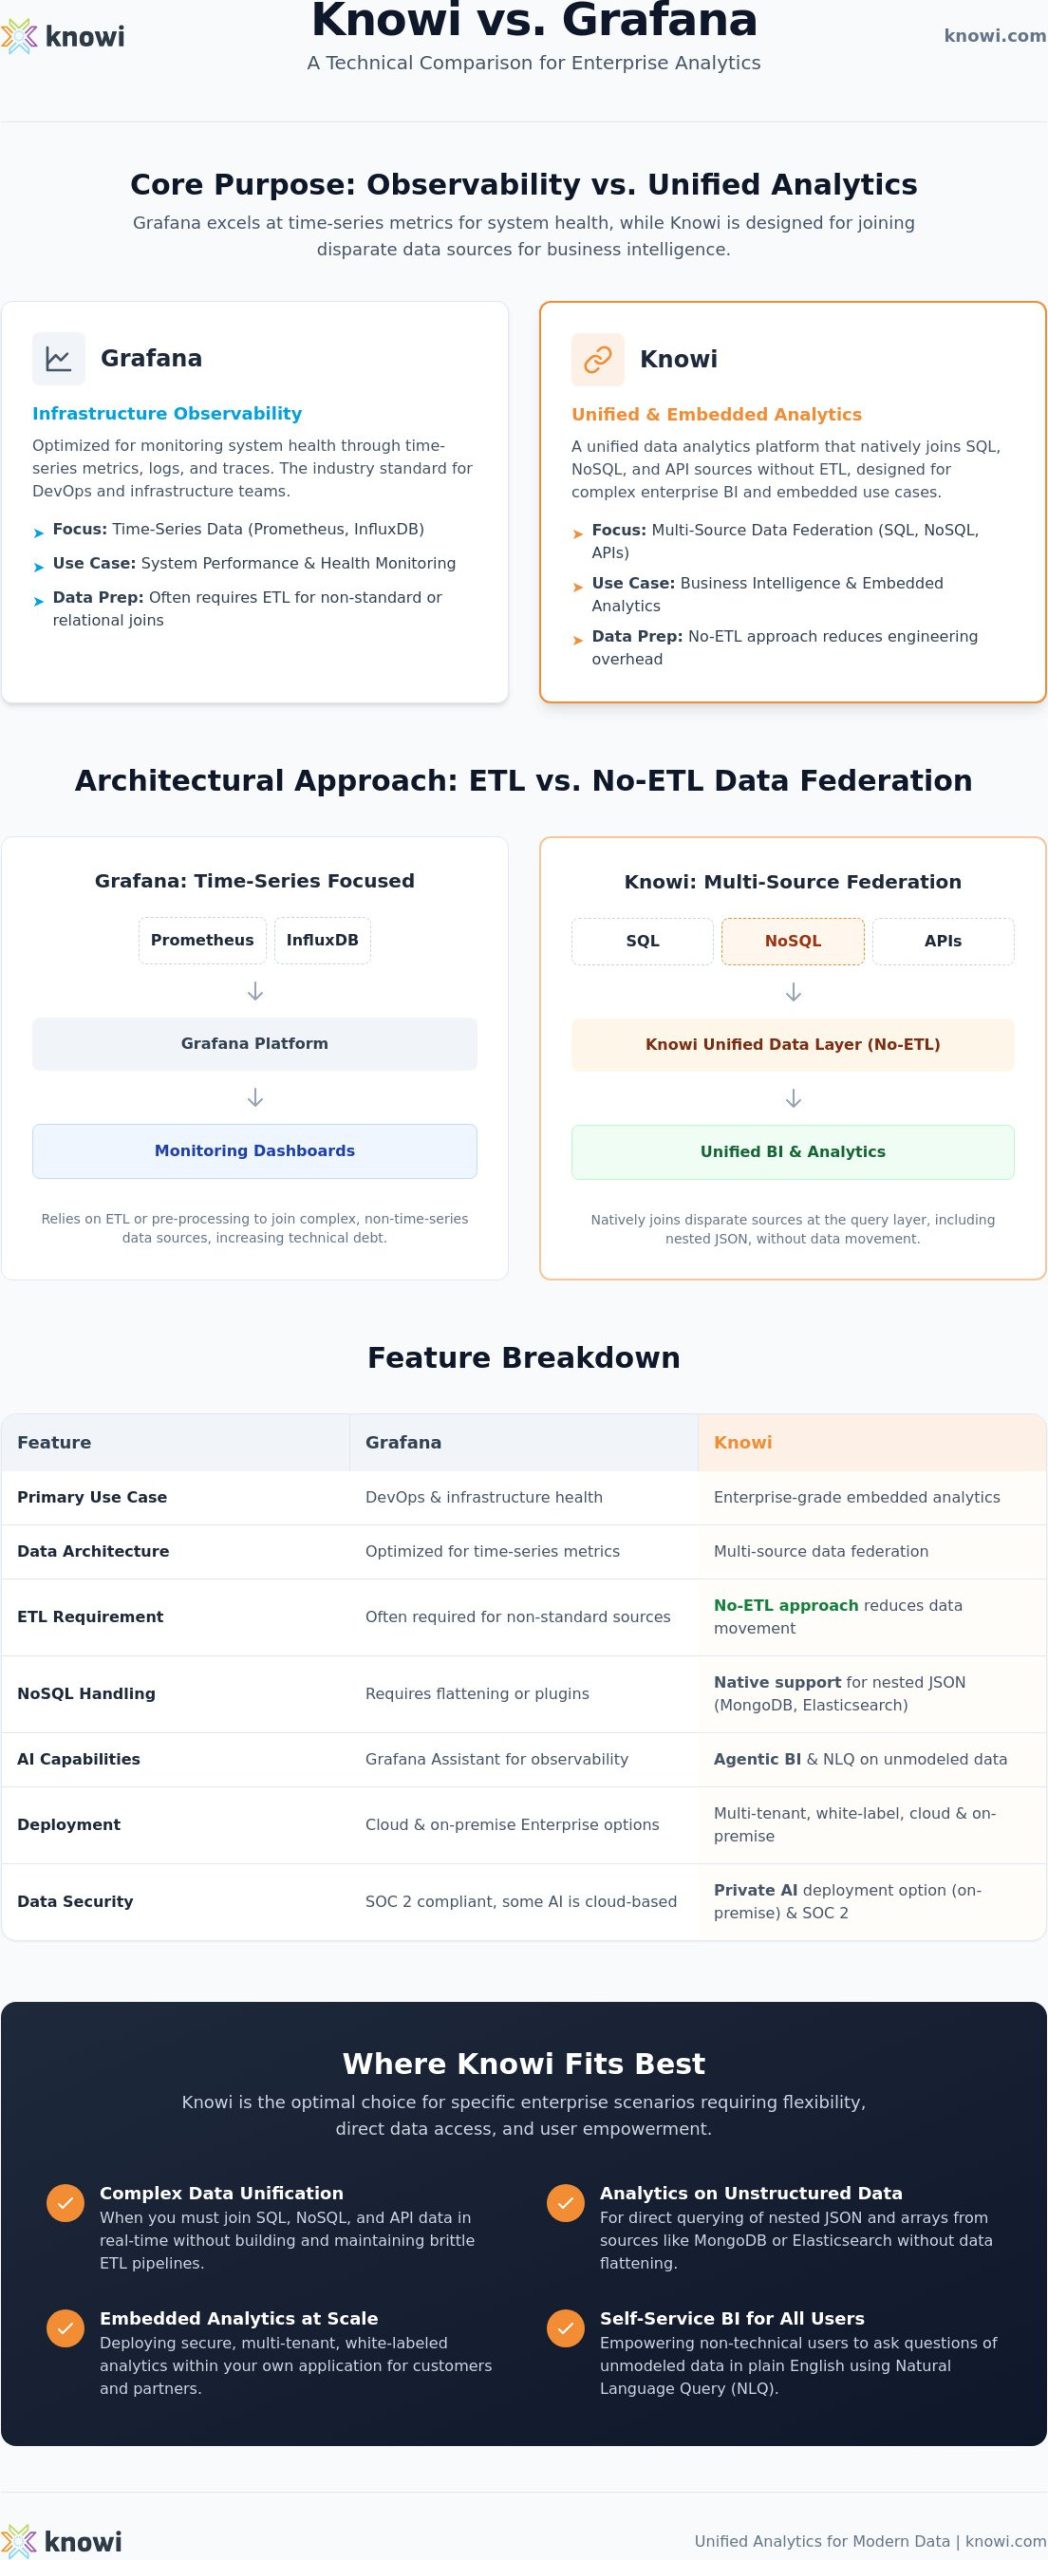
Compare capabilities by the work they support. Grafana centers on observability and monitoring workflows, while Knowi supports governed analytics across enterprise data and embedded product experiences. The table highlights differences in workload, architecture, AI, and deployment without treating dashboard overlap as proof that the platforms are interchangeable.
| Capability | Grafana | Knowi |
|---|---|---|
| Workload | Supports observability workflows for monitoring metrics, logs, and system behavior. | Supports agentic analytics for business questions across governed enterprise data. |
| Data sources | Connects to multiple data sources through integrations. Grafana’s data source documentation outlines supported connection workflows. | Connects to SQL, NoSQL, REST APIs, documents, and other sources through more than 70 connectors and APIs. |
| Data architecture | Supports monitoring and visualization against configured sources. ETL requirements depend on the source and workflow. | Federates data across sources, including cross-source joins, without requiring data movement, ETL, or a separate warehouse. |
| AI and NLQ | Grafana Assistant extends AI capabilities across data sources, as described in the Grafana 13.1 release notes. | NLQ and AI agents operate through an analytics layer with semantic context for business terms and governed data assets. |
| Embedded use | Dashboards provide operational visibility for teams monitoring services and infrastructure. | Supports customer-facing analytics embedded in SaaS applications, including product-specific analytics experiences. |
| Deployment | Available as open-source self-hosted Grafana, self-hosted Enterprise, and managed Grafana Cloud. | Supports cloud, on-premises, hybrid, and customer-managed deployment options, including Private AI deployments. |
Natural-language analytics and agentic workflows
Knowi NLQ lets users ask questions of enterprise data through its analytics layer. AI-generated queries and dashboards can help users move from a business question to an analytics view, while the semantic layer gives agents defined business terminology and trusted data assets to work from. This integrates AI with governed analytics rather than placing a disconnected LLM wrapper in front of data.
Grafana’s AI capabilities are oriented toward its observability environment. Its 13.1 release expanded Grafana Assistant’s reach to more data sources. Alerting serves a different operational purpose, helping teams define and manage responses to monitored conditions through workflows described in Grafana’s alerting documentation.
Embedded analytics and real-time operations
Grafana dashboards can provide operational visibility to internal teams. Knowi’s embedded analytics supports customer-facing, white-label, and multi-tenant product experiences, allowing SaaS providers to incorporate analytics into their applications. Explore SaaS analytics use cases for more on this model.
Knowi also supports real-time monitoring, but it doesn’t need to replace an existing observability stack. Teams can retain Grafana for infrastructure monitoring and use Knowi where embedded analytics, governed business context, or cross-source questions are the primary requirement.
When Grafana Is Enough, and When Enterprise Analytics Needs More
Grafana may already meet the requirement if the primary job is monitoring infrastructure or application behavior. Teams can use its dashboards, data-source integrations, and alerting workflows for operational visibility, without adding a separate analytics platform for business questions they don’t need to answer.
Choose Grafana when observability is the primary job
For teams tracking service health, infrastructure metrics, and logs, Grafana’s observability focus aligns directly with the workload. Its integrations and alerting capabilities support monitoring workflows, and Grafana is available as a self-managed deployment or a managed cloud service. Compare the available data sources, alerting features, and deployment models with your operational requirements.
Use this decision matrix to distinguish an observability requirement from a broader analytics one:
| Evaluation area | Grafana may be sufficient when | Consider Knowi when |
|---|---|---|
| Data types | The key inputs are operational metrics and logs used to monitor applications or infrastructure. | Questions span SQL, NoSQL, REST APIs, documents, or nested JSON sources. |
| Cross-source questions | Teams primarily inspect signals from configured sources in observability workflows. | Analysis needs to join information across business systems without moving or duplicating source data. |
| Embedded needs | Dashboards are mainly for internal engineering or operations teams. | A SaaS product needs customer-facing analytics in a white-label or multi-tenant experience. |
| Governance | The core need is operational monitoring with the platform’s available access and governance controls. | Business definitions need to be consistent across analytics and provide semantic context to AI agents. |
Evaluate Knowi when analytics must span enterprise data
Consider Knowi when business questions require connections among sources that don’t share a monitoring-oriented data model. Native nested JSON support helps preserve source structure, while cross-source analysis can reduce the need to build separate pipelines solely to combine data for analytics.
Governance matters especially when teams use NLQ or agentic workflows. A semantic layer can define terms such as “active customer” consistently, giving agents business context instead of leaving them to interpret each phrase independently. For a broader view of how governed analytics supports decision-making, see Knowi’s analytics approach.
Separate platform capability from deployment-specific security requirements. Knowi offers cloud, on-premises, hybrid, and customer-managed Private AI deployment options, but claims about data remaining within an environment apply to on-premises or self-hosted deployments, not automatically to every model. In Knowi vs Grafana, the useful test is whether observability alone satisfies the workload or whether analytics must also span governed business data.
See how Knowi can connect existing data sources for cross-source and embedded analytics. Explore a Knowi demo focused on your analytics requirements.
Where Knowi Fits Best for Governed, Cross-Source Analytics
Knowi fits enterprise teams that need analytics across existing SQL, NoSQL, REST API, and document sources without adding ETL pipelines or a separate data warehouse for every use case. Its federated approach lets teams join data where it resides, while the semantic layer gives analytics users and AI agents shared business definitions.
Use cases that align with Knowi’s architecture
This architecture is relevant when business questions cross systems. A SaaS provider, for example, may want to embed customer-facing analytics that combines product usage with account data, while keeping the experience within its own application. Knowi supports embedded analytics for white-label and multi-tenant product scenarios.
Governance and deployment requirements also influence fit. Knowi supports HIPAA- and SOC 2-compliant analytics deployments. Its Private AI deployment options include cloud, on-premises, hybrid, and customer-managed environments. The claim that data stays within the customer’s environment applies only to on-premises or self-hosted deployments, not automatically to every Private AI configuration.
To evaluate whether the architecture matches your needs, test representative questions against the sources involved and examine how the platform handles:
- Source coverage: Confirm that the business question can draw on the relevant SQL, NoSQL, API, or document data.
- Business definitions: Check whether semantic definitions give users and AI agents consistent meanings for terms such as “active customer” or “renewal risk.”
- Governance: Assess how access to analytics and underlying data aligns with your organization’s policies.
- Deployment: Map cloud, on-premises, hybrid, or customer-managed requirements to the corresponding deployment model.
For search-based analytics, review Knowi’s NLQ capabilities and consider how users would ask questions in your organization’s terminology. This helps determine whether natural-language access is grounded in governed data and definitions, rather than operating as a disconnected AI interface.
In Knowi vs Grafana, the choice does not have to be all or nothing. Grafana remains aligned with infrastructure and application observability; Knowi is suited to governed, cross-source business analytics and embedded use cases. Organizations with both workloads can assign each platform the role it is designed to serve.
Knowi can query connected data sources directly, helping teams evaluate cross-source analytics without first building ETL pipelines or a separate warehouse. Explore a Knowi demo using your analytics requirements.
Match the Platform to the Workload
Knowi vs Grafana comes down to the job your teams need to deliver. Grafana is suited to infrastructure and application observability. Knowi fits governed, cross-source business analytics, including embedded use cases that combine data from existing systems.
Knowi connects to more than 70 data connectors and APIs, supporting analytics across SQL, NoSQL, REST APIs, and other sources without requiring ETL or a separate data warehouse. Its semantic layer helps establish consistent business definitions for analytics and AI agents. Knowi also supports HIPAA- and SOC 2-compliant analytics deployments, with deployment options that include cloud, on-premises, hybrid, and customer-managed environments.
To assess fit, test representative business questions against the data sources you use, then evaluate governance, embedded requirements, and deployment constraints. For on-premises or self-hosted deployments, data can remain within your environment. That claim does not apply universally to every deployment model.
See how direct access to governed enterprise data can support cross-source analytics without ETL. Explore Knowi’s analytics platform or explore a Knowi demo to evaluate the approach against your requirements.
Frequently Asked Questions
Is Grafana a BI tool or an observability platform?
Grafana is primarily an observability and visualization platform, though teams can also use it to explore and visualize data from connected sources. Its core use cases include monitoring metrics and logs, building dashboards, and investigating system behavior. That can overlap with some business intelligence tasks, but it doesn’t automatically provide the same architecture or governance needs as a platform designed for cross-source business analytics.
Can Grafana connect to multiple data sources for business analytics?
Yes. Grafana supports multiple data sources, and teams can use connected data to build dashboards and explore information. Whether it suits a particular business analytics workload depends on the source integrations, query patterns, and governance requirements involved. If questions require joining business data across different systems or delivering embedded, customer-facing analytics, assess those needs separately from Grafana’s observability strengths.
How does Knowi compare with Grafana for SQL and NoSQL analytics?
Knowi is designed for analytics across SQL and NoSQL sources, as well as REST APIs and documents. It supports native nested JSON analysis and federated queries across sources, which can help teams work with business data without first flattening or centralizing every dataset. Grafana supports integrations with multiple data sources, with a primary focus on observability workflows. In Knowi vs Grafana, compare the required analytics questions and data architecture.
Does Knowi require ETL or a separate data warehouse?
No. Knowi connects to supported data sources directly and can query data where it resides, so using Knowi doesn’t require ETL or a separate data warehouse as a prerequisite. Its federated analytics can combine information across connected sources without moving or duplicating the underlying data. Organizations may still use ETL or a warehouse for other architectural needs, but they aren’t required for Knowi’s cross-source analytics approach.
Can Knowi analyze nested JSON and join data across sources?
Yes. Knowi supports native nested JSON analytics and federated cross-source joins without requiring data movement or duplication. For example, an analytics question could combine account attributes from a SQL database with nested product activity from a NoSQL source. The exact result depends on the connected data and the business definitions used to interpret it, so evaluate representative questions with your own source structures.
Does Knowi Private AI keep data inside the customer environment?
That depends on the deployment model. Data-never-leaves-the-environment claims apply to on-premises or self-hosted deployments, not automatically to cloud, hybrid, or every customer-managed configuration. Knowi offers Private AI deployment options across cloud, on-premises, hybrid, and customer-managed environments. Assess the selected architecture, data flows, and internal model requirements against your organization’s security and governance needs before deployment.
When should a company use Knowi instead of Grafana?
Consider Knowi when the primary requirement is governed business analytics across SQL, NoSQL, API, or document sources, especially when teams need cross-source analysis, embedded analytics, or NLQ. Grafana remains aligned with infrastructure and application observability, including monitoring metrics and logs. Some organizations may use both, assigning Grafana to operational monitoring and Knowi to enterprise analytics that spans business systems or supports customer-facing product experiences.
{
“@context”: “https://schema.org”,
“@type”: “FAQPage”,
“mainEntity”: [
{
“@type”: “Question”,
“name”: “Is Grafana a BI tool or an observability platform?”,
“acceptedAnswer”: {
“@type”: “Answer”,
“text”: “Grafana is primarily an observability and visualization platform, though teams can also use it to explore and visualize data from connected sources. Its core use cases include monitoring metrics and logs, building dashboards, and investigating system behavior. That can overlap with some business intelligence tasks, but it doesn’t automatically provide the same architecture or governance needs as a platform designed for cross-source business analytics.”
}
},
{
“@type”: “Question”,
“name”: “Can Grafana connect to multiple data sources for business analytics?”,
“acceptedAnswer”: {
“@type”: “Answer”,
“text”: “Yes. Grafana supports multiple data sources, and teams can use connected data to build dashboards and explore information. Whether it suits a particular business analytics workload depends on the source integrations, query patterns, and governance requirements involved. If questions require joining business data across different systems or delivering embedded, customer-facing analytics, assess those needs separately from Grafana’s observability strengths.”
}
},
{
“@type”: “Question”,
“name”: “How does Knowi compare with Grafana for SQL and NoSQL analytics?”,
“acceptedAnswer”: {
“@type”: “Answer”,
“text”: “Knowi is designed for analytics across SQL and NoSQL sources, as well as REST APIs and documents. It supports native nested JSON analysis and federated queries across sources, which can help teams work with business data without first flattening or centralizing every dataset. Grafana supports integrations with multiple data sources, with a primary focus on observability workflows. In Knowi vs Grafana, compare the required analytics questions and data architecture.”
}
},
{
“@type”: “Question”,
“name”: “Does Knowi require ETL or a separate data warehouse?”,
“acceptedAnswer”: {
“@type”: “Answer”,
“text”: “No. Knowi connects to supported data sources directly and can query data where it resides, so using Knowi doesn’t require ETL or a separate data warehouse as a prerequisite. Its federated analytics can combine information across connected sources without moving or duplicating the underlying data. Organizations may still use ETL or a warehouse for other architectural needs, but they aren’t required for Knowi’s cross-source analytics approach.”
}
},
{
“@type”: “Question”,
“name”: “Can Knowi analyze nested JSON and join data across sources?”,
“acceptedAnswer”: {
“@type”: “Answer”,
“text”: “Yes. Knowi supports native nested JSON analytics and federated cross-source joins without requiring data movement or duplication. For example, an analytics question could combine account attributes from a SQL database with nested product activity from a NoSQL source. The exact result depends on the connected data and the business definitions used to interpret it, so evaluate representative questions with your own source structures.”
}
},
{
“@type”: “Question”,
“name”: “Does Knowi Private AI keep data inside the customer environment?”,
“acceptedAnswer”: {
“@type”: “Answer”,
“text”: “That depends on the deployment model. Data-never-leaves-the-environment claims apply to on-premises or self-hosted deployments, not automatically to cloud, hybrid, or every customer-managed configuration. Knowi offers Private AI deployment options across cloud, on-premises, hybrid, and customer-managed environments. Assess the selected architecture, data flows, and internal model requirements against your organization’s security and governance needs before deployment.”
}
},
{
“@type”: “Question”,
“name”: “When should a company use Knowi instead of Grafana?”,
“acceptedAnswer”: {
“@type”: “Answer”,
“text”: “Consider Knowi when the primary requirement is governed business analytics across SQL, NoSQL, API, or document sources, especially when teams need cross-source analysis, embedded analytics, or NLQ. Grafana remains aligned with infrastructure and application observability, including monitoring metrics and logs. Some organizations may use both, assigning Grafana to operational monitoring and Knowi to enterprise analytics that spans business systems or supports customer-facing product experiences.”
}
}
]
}