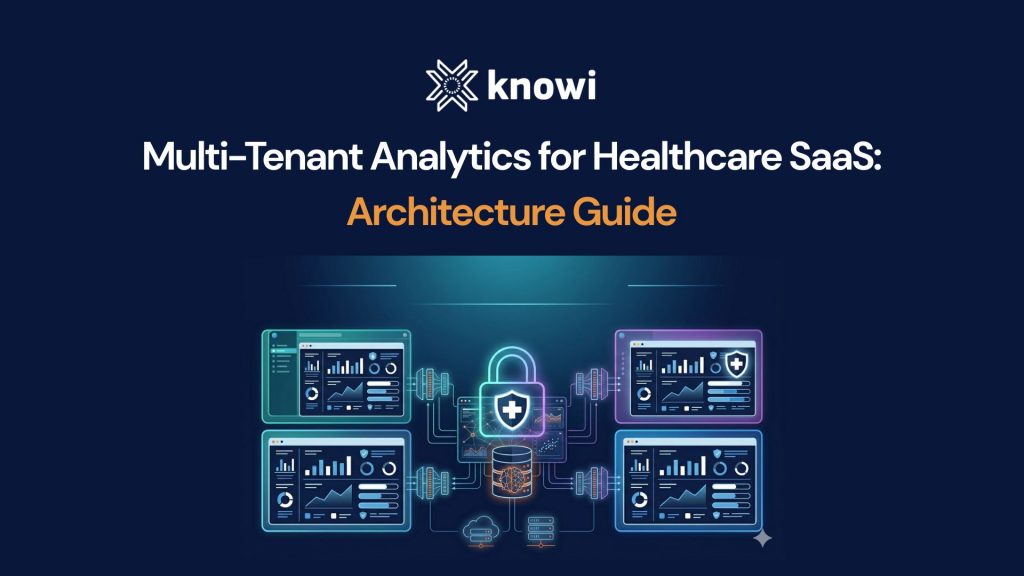
Multi-Tenant Analytics for Healthcare SaaS: Architecture Guide
Multi-tenant analytics for healthcare SaaS means embedding a single analytics platform into your product that serves multiple healthcare customers, with each tenant’s data strictly isolated
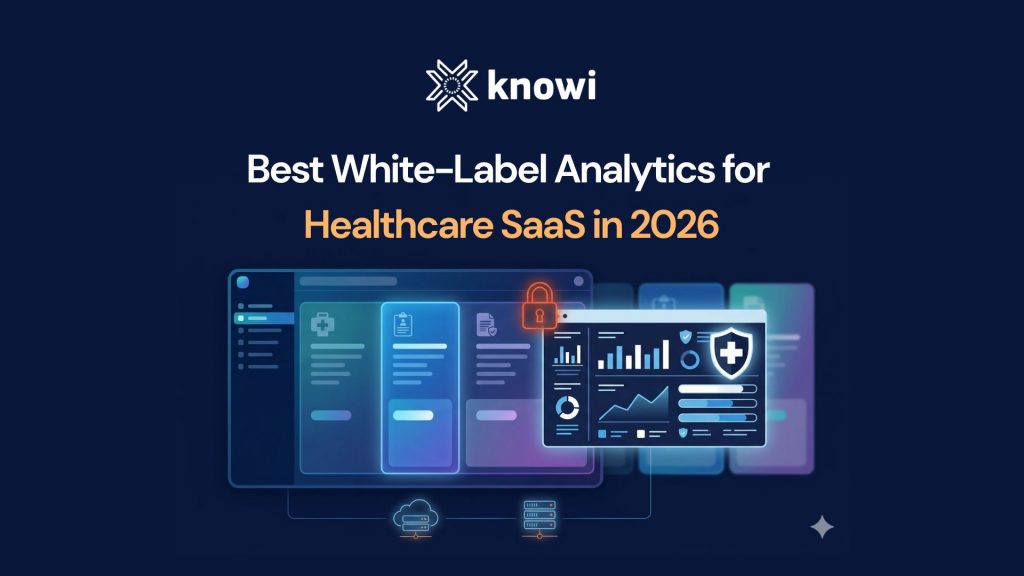
Best White-Label Analytics for Healthcare SaaS in 2026
The best white-label analytics platforms for healthcare SaaS in 2026 are embedded analytics tools that support full branding customization, multi-tenant PHI isolation, on-premise deployment, and
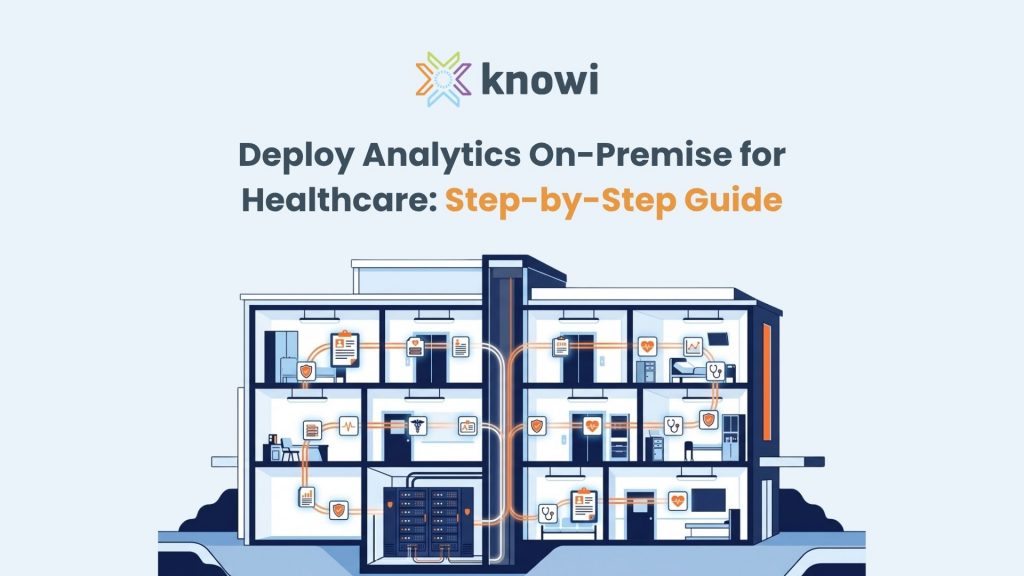
Deploy Analytics On-Premise for Healthcare: Step-by-Step Guide
To deploy analytics on-premise for healthcare, install the analytics platform inside the organization’s data center or private cloud, connect it directly to source databases, configure
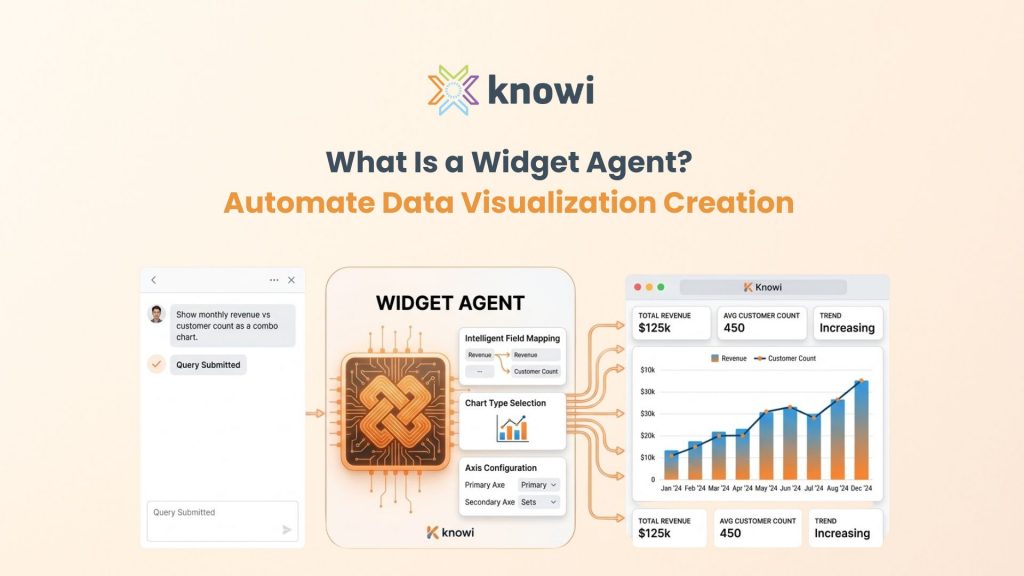
What Is a Widget Agent? Automate Data Visualization Creation (2026)
A widget agent creates charts and visualizations from natural language. Learn how intelligent field mapping, chart selection, and combo chart generation work in agentic BI systems.
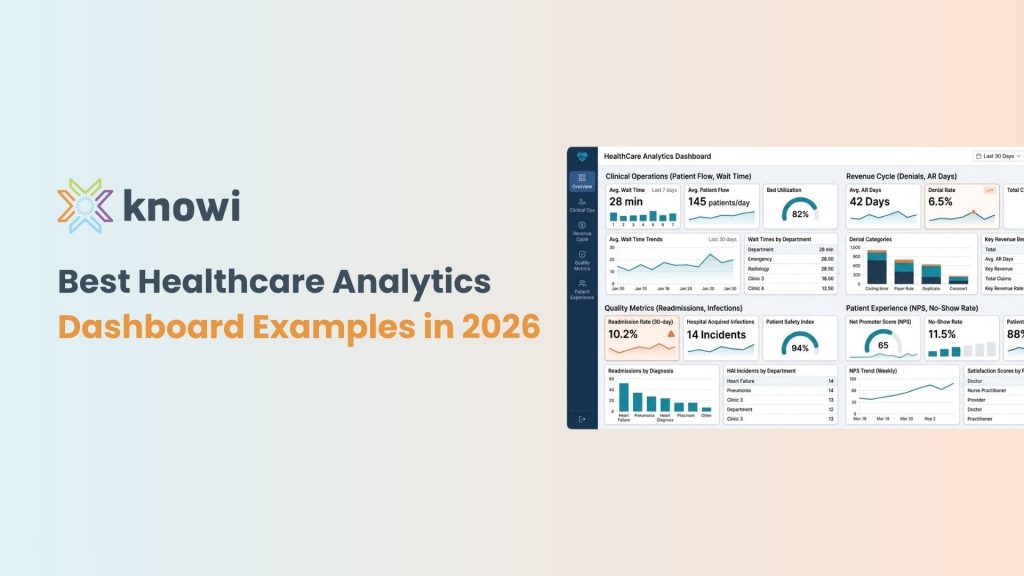
What Are the Best Healthcare Analytics Dashboard Examples in 2026?
The best healthcare analytics dashboards in 2026 cover clinical operations, quality and safety, revenue cycle, claims analytics, compliance monitoring, patient experience, and multi-clinic performance. Each
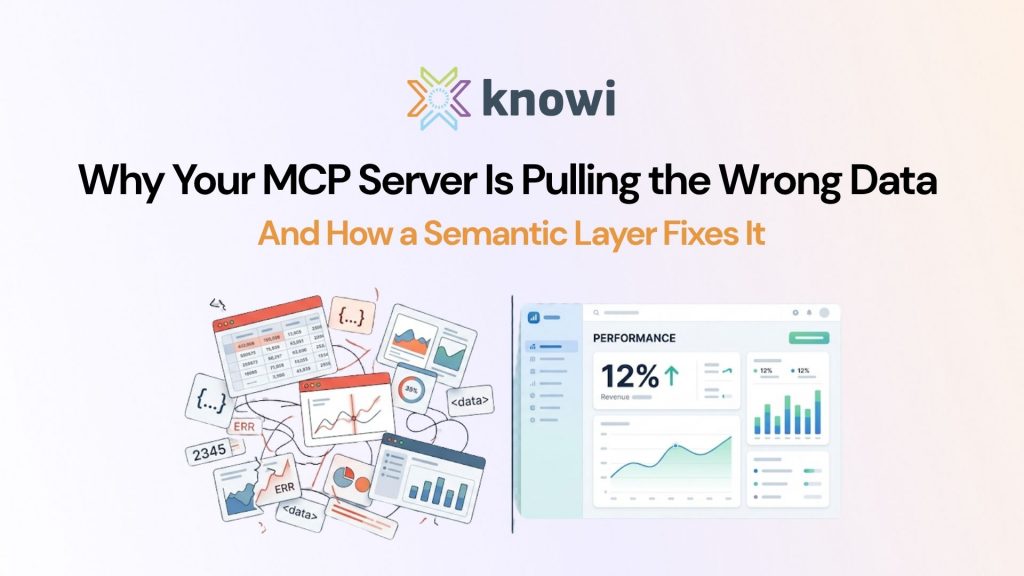
Why Your MCP Server Is Pulling the Wrong Data (And How a Semantic Layer Fixes It)
MCP gives AI agents a way to connect to your databases, APIs, and tools. But connecting to data is not the same as understanding it.
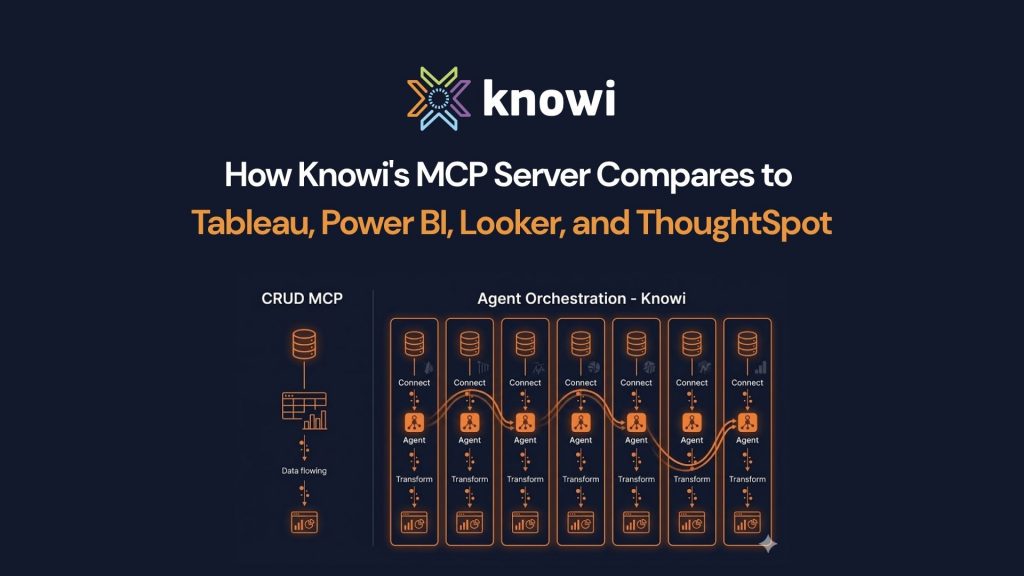
How Knowi’s MCP Server Compares to Tableau, Power BI, Looker, and ThoughtSpot
Every major BI platform has an MCP server now. Here’s how they differ: agent orchestration vs CRUD, data source coverage, embedded agentic support, and pricing.
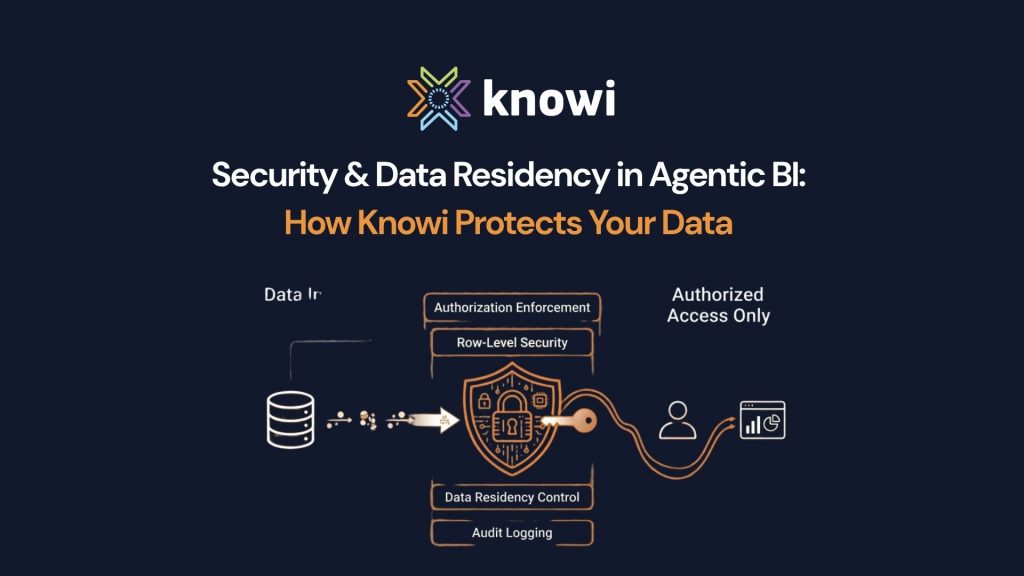
When AI agents query your database, a critical question emerges: What data does the AI actually see? Where does it go? Who controls it?
When AI agents query your data, where does it go? Knowi enforces authorization, row-level security, multi-tenancy, and data residency – with zero leakage.
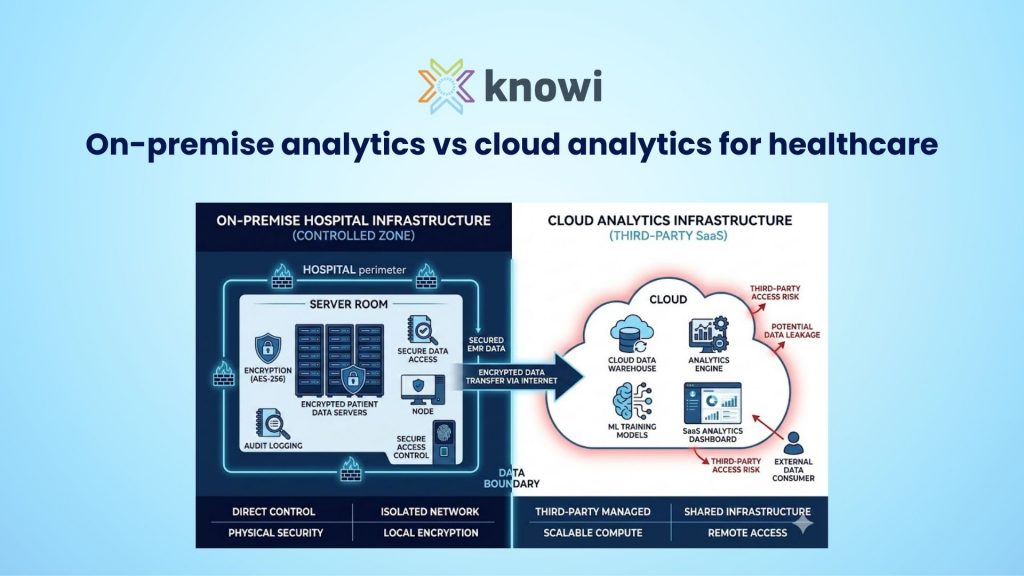
On-Premise vs Cloud Analytics for Healthcare: Which Is More Secure?
On-premise analytics keeps PHI inside your infrastructure while cloud analytics introduces shared responsibility. This guide compares security, compliance, and deployment models for healthcare analytics.